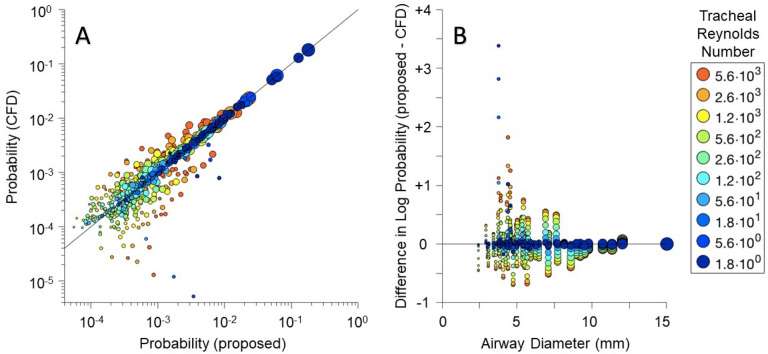
Figure 8.
The linear relationship between predicted probabilities for a 3.5 micron sized particle using either a computational fluid dynamics (CFD) simulation or a resistance-based approach (proposed) is shown in (A). Each circle represents particle capture probabilities for an airway segment, with size indicating airway diameter and color indicating tracheal Re. The solid line represents identical probability predictions by each model. The relationship between discrepant probability predictions and airway diameter is shown in (B).

