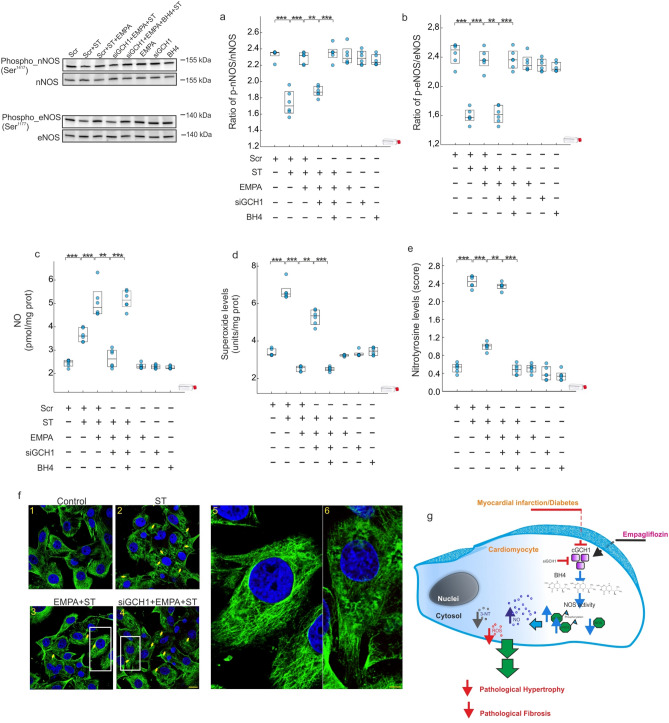
Figure 7.
Empagliflozin modulates NOS activity and cardiac GCH1. (a,b) A representative western blot analysis of nNOS and eNOS activation. (c) NO levels. (d) O2.- levels. (e) Nitrotyrosine levels. (f) Confocal microscopy images following immunofluorescence analysis performed with cardiomyocytes expressing tubulin (green). Scale bar in image 4, also applicable to 1, 2 and 3, was 40 μm whereas in image 5 and 6, was 10 μm. (g) Model of Empagliflozin action in the myocardium. All quantifications derive from six independent experiments/group. The results are displayed as scatter plots and summarized with boxplots. **p < 0.01, ***p < 0.001.

