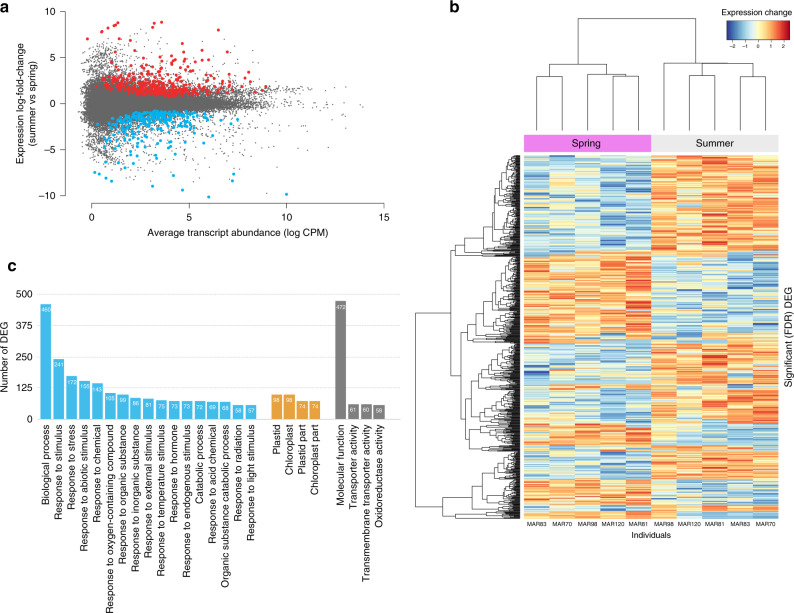
Fig. 4. Between-season differences in floral transcriptomes.
a MA plot showing the change in expression levels, quantified as log-fold change ((expression level in summer flowers−expression level in spring flowers)/expression level in spring flowers) in samples from one starting-to-open flower bud during experimental spring conditions, and another flower bud during experimental mild summer conditions in five plants. Each dot represents a transcript, and log2-fold change (summer flower/spring flower) is plotted against average abundance in log of counts per million (log CPM). Red dots indicate differentially overexpressed transcripts (false discovery rate adjusted P-values < 0.05) in summer flowers, blue dots indicate differentially under-expressed transcripts in summer flowers. b Heatmap of hierarchical clustering of the expression matrix of the 627 differentially expressed genes (DEG) in the five individuals in each season. c The first 25 enriched gene ontology (GO) classes after the comparison of GO terms between the DEG and the 47,440 genes that passed the criteria for inclusion in the analyses. GO terms are distributed in three main categories: biological processes (blue bars), cellular components (orange bars), and molecular functions (grey bars). Numbers inside columns indicate the number of DEG in that category.

