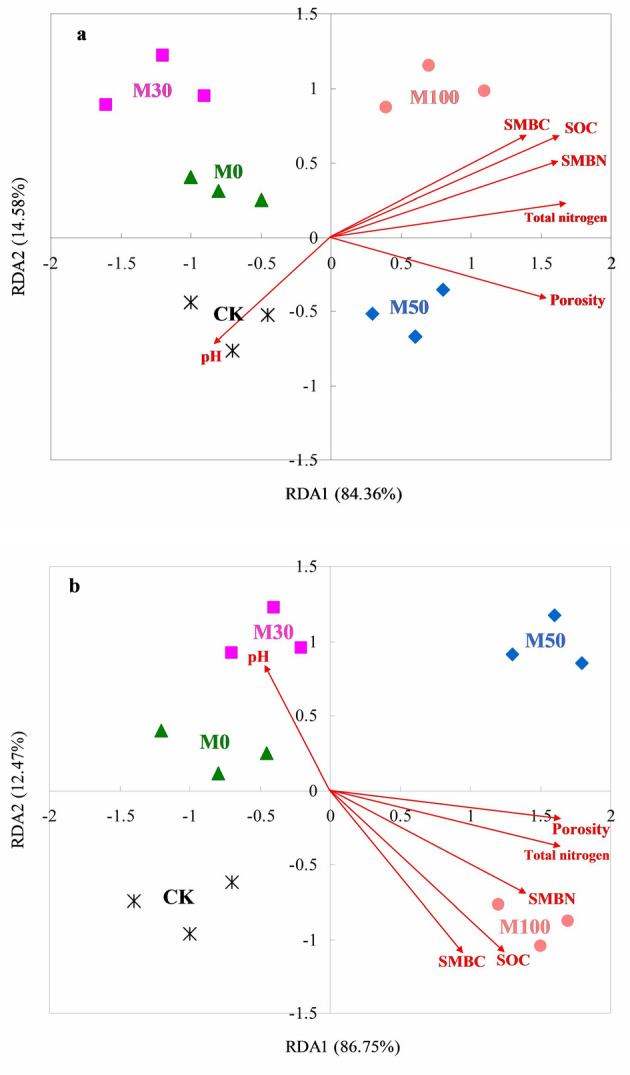
Figure 3.

Redundancy analysis of soil bacterial (a) and fungal (b) abundant phyla and soil characteristics (arrows) of different fertilizer treatments. M0: 100% N of chemical fertilizer (triangle); M30: 30% N of organic manure and 70% N of chemical fertilizer (square); M50: 50% N of organic manure and 50% N of chemical fertilizer (prismatic); M100: 100% N of organic manure (circle); CK: without N fertilizer input as control (asterisk).
