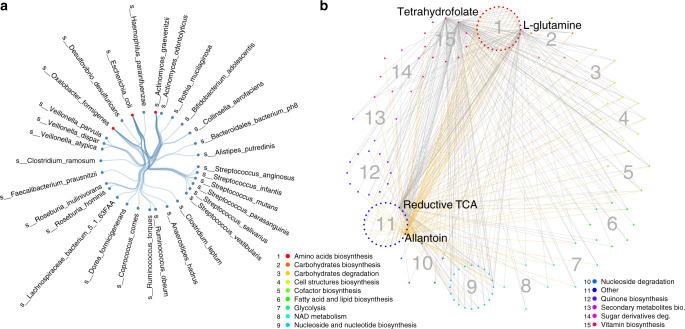
Fig. 4. Cohort-specific species and pathway co-abundances.
a Cohort-specific co-abundances identified for three key species in the IBD cohort, involving 33 IBD-specific co-abundances. Each dot indicates one species. Red indicates IBD key species. Each line represents one IBD-specific co-abundance relationship. b Cohort-specific co-abundances identified for four key pathways in IBD and one key pathway in 300OB, involving 385 cohort-specific co-abundances. Each line represents a cohort-specific correlation between two pathways. Yellow lines represent obesity-specific co-abundances. Grey lines represent IBD-specific co-abundances. Each dot indicates one pathway. Pathways belonging to the same metabolic category have the same colour and are clustered as sub-circles. Colour legends are shown in the plot.

