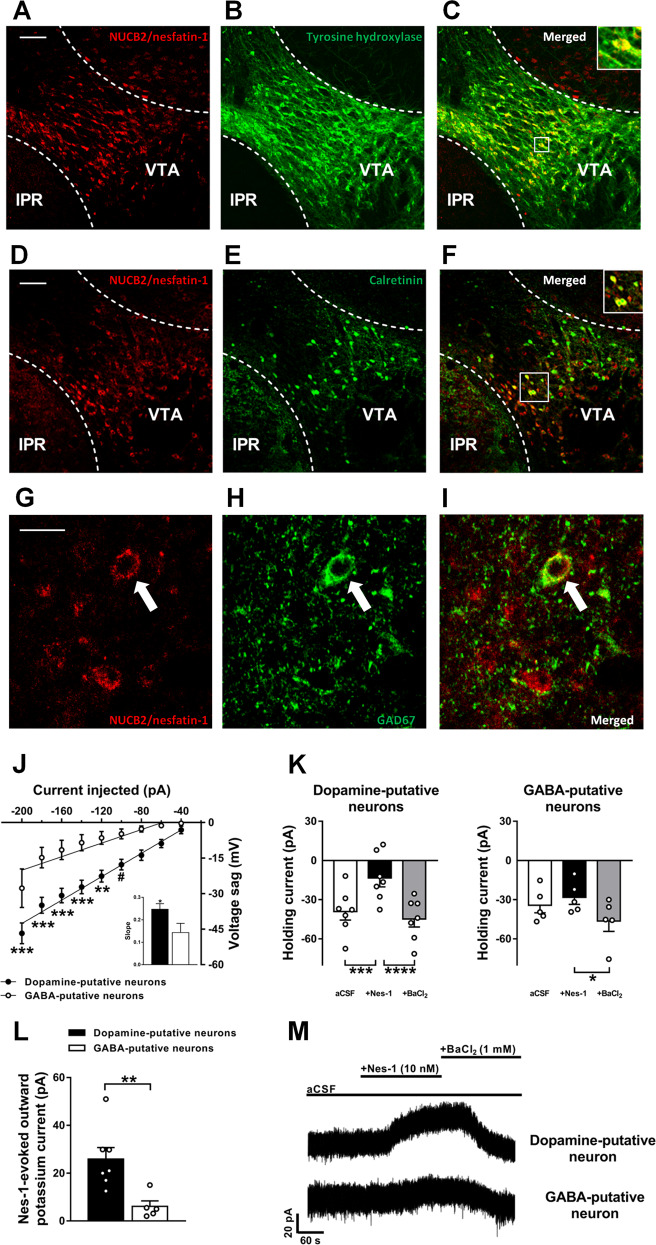
Fig. 1. NUCB2/nesfatin-1 is expressed in the VTA and hyperpolarizes dopamine, but not GABA, neurons.
Representative confocal images of wild-type mice midbrain coronal section (bregma: −3.40 mm) showing NUCB2/nesfatin-1 (a and d), TH (b) and calretinin (e) positive neurons in the VTA, and merged images showing that NUCB2/nesfatin-1-containing neurons also express TH (c) and calretinin (f), markers for dopamine and GABA neurons, respectively. Confocal images of NUCB2/nesfatin-1 (g) and GAD67 (h) positive neurons in the VTA, and merged image showing one representative NUCB2/nesfatin-1-containing neuron also expressing GAD67 (i). Scale bar: 100 µm in A-F and 20 µm in G-I. IPR, rostral interpeduncular nucleus; VTA, ventral tegmental area. Putative dopamine and GABA neurons of the VTA were identified electrophysiologically by sag potential amplitude in response to negative current injection (−20 pA steps) (j). Inset shows the comparison of the slopes of the linear regression lines. Mean quantification of the baseline (aCSF) holding current shift induced by nesfatin-1 and BaCl2 superfusion of putative dopamine and GABA neurons of the VTA (K) (Nneurons = 5–7, Nmice = 4). Mean quantification of nesfatin-1-evoked potassium outward current in putative dopamine and GABA neurons of the VTA (l). Representative holding current traces from VTA neurons held at -50 mV of wild-type mice showing the outward current evoked by bath application of nesfatin-1 (10 nM) in putative dopamine neurons, which was blocked by BaCl2 (1 mM). No effects in putative GABA neurons were found (M). Data represent mean ± SEM. #P < 0.1, *P < 0.05, **P < 0.01, ***P < 0.001 and ****P < 0.0001 vs. respective control group (Tukey’s post hoc test or Student’s t test).

