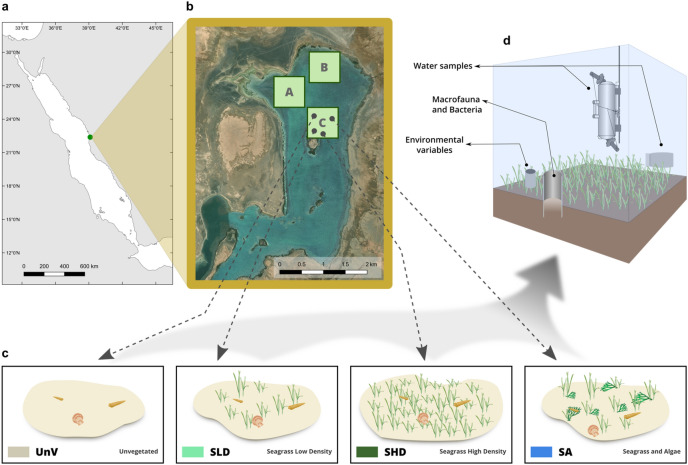
Figure 1.
Map showing the location of the Al Qadimah lagoon, the three locations where samples were collected (a, b), as well as an illustration of the different treatments (c) and sampling strategy (d). Unvegetated (UnV); Seagrass Low Density (SLD); Seagrass High Density (SHD); Seagrass and Algae (SA). A, B, and C denote the three locations. (a) The map was created in QGIS Geographic Information System. Open Source Geospatial Foundation Project. https://qgis.org version 3.10.4—A Coruña. (b) satellite imagery from: Esri, “World Imagery" [basemap], https://services.arcgisonline.com/ArcGIS/rest/services/World_Imagery/MapServer, (April 5, 2020). ClipArts of benthic organisms represented (c) from IAN Image Library (ian.umces.edu/imagelibrary).

