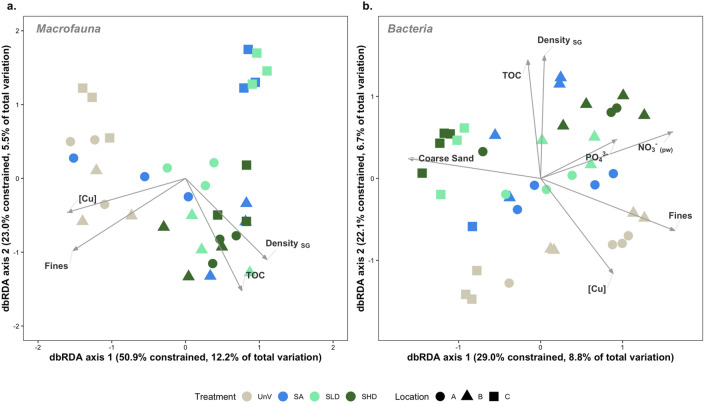
Figure 6.
Distance based redundancy analysis (dbRDA) of macrofaunal (a) and bacterial (b) samples based on Bray–Curtis distance matrices. The dbRDA axes describe the percentage of the fitted or total variation explained by each axis. Samples are colored by treatment type, whereas locations (A, B and C) are represented by symbols. Unvegetated (UnV); seagrass and algae (SA) mixed meadows; seagrass low density (SLD); seagrass high density (SHD). TOC, total organic carbon; Fines, sediment fraction < 63 μm; Coarse Sand, sediment fractions between 0.5 and 1 mm; [Cu], Concentration of trace metal copper in sediments (mg/kg); Density SG, Seagrass density; pw denotes dissolved inorganic nutrients quantified in sediment pore water. The length of each environmental vector is related to the contribution to the total variance.

