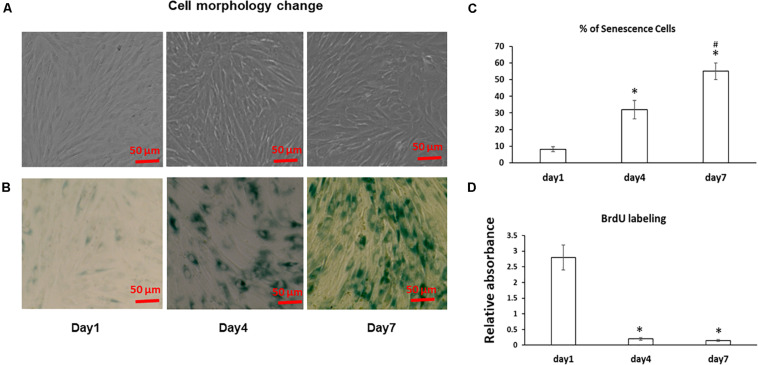
FIGURE 1.
Cell morphology change and aging in BMSC sheet cultures. (A) BMSCs were cultured in cell sheets at Days 1, 4, 7 and visualized by microscope. Scale bar, 100 μm. (B) SA-β-gal staining was performed to determine the extent of senescence in 1, 4, and 7 Day cell sheet cultures. Scale bar represents 100 μm. (C) SA-β-gal positive cells were quantitated by ImageJ. (D) Cell proliferation was determined by BrdU labeling in cell sheet cultures at Days 1, 4, and 7. All experiments were performed in triplicate. *P < 0.05 vs. Day 1 cells and #P < 0.05 vs. Day 4 cells.

