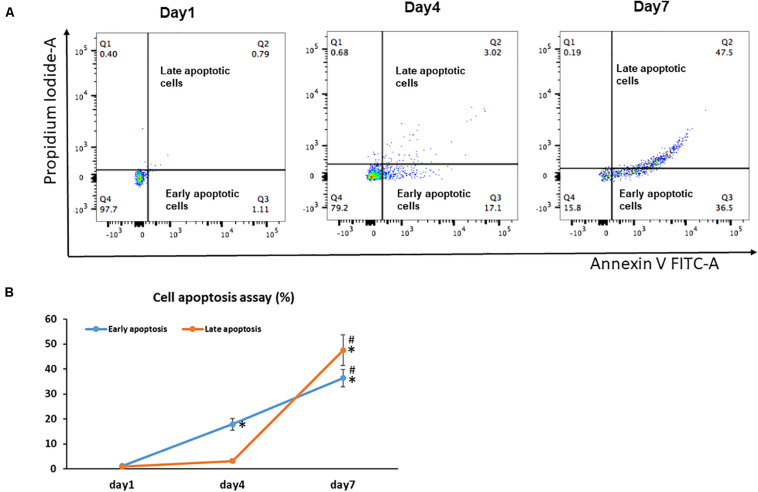
FIGURE 2.
Cell apoptosis in BMSC sheet cultures. Cells from Days 1, 4, and 7 cultures were stained with Annexin V and PI, and the populations corresponding to viable and non-apoptotic (Annexin V– PI–), early (Annexin V+PI–), and late (Annexin V+PI+) apoptotic cells. (A) Representative flow cytometry graphs of cell apoptotic analysis. (B) The percentage of early apoptotic cells and the percentage of late apoptotic cells in Days 1, 4, and 7 cultures. Results are mean ± SD. All experiments were performed in triplicate. *P < 0.05 vs. Day 1 cells and #P < 0.05 vs. Day 4 cells.

