
Figure 5.
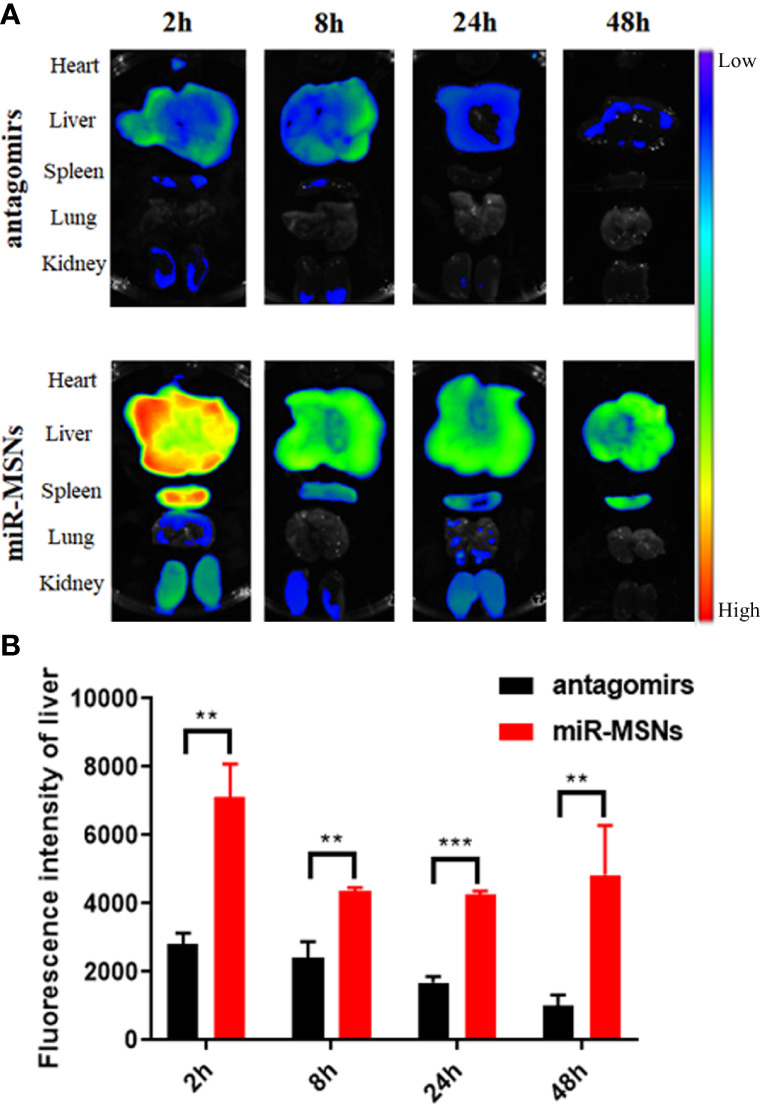
Bio-distribution evaluation. n=3. (A) Ex vivo fluorescence images of major organs (heart, liver, spleen, lung, and kidney) after administration. (B) Quantitative analysis of the distribution of miR-33 antagomirs in the liver. **p < 0.01, and ***p < 0.001.