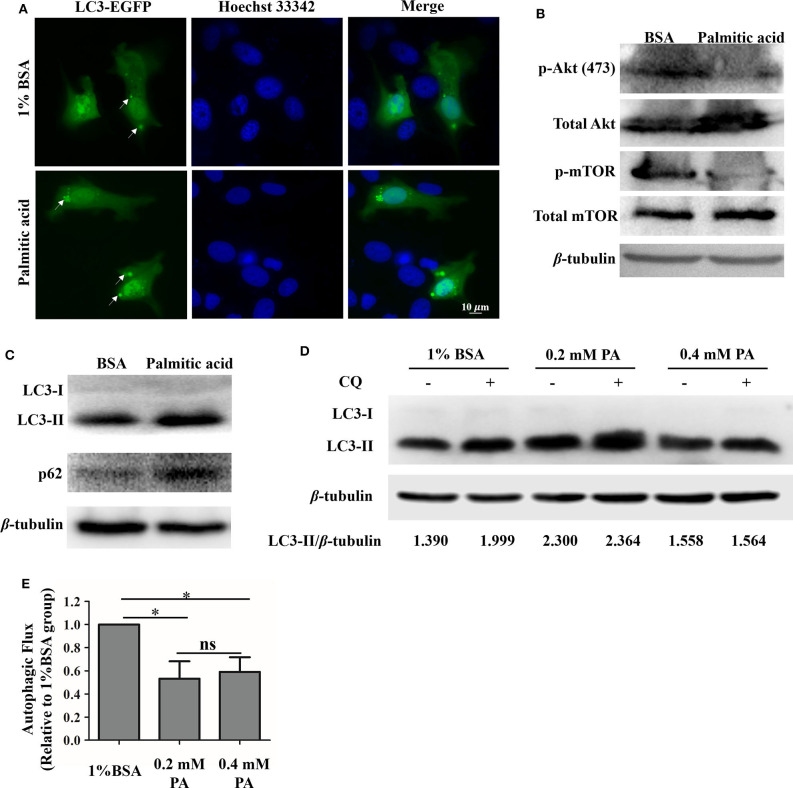
Figure 5.
Palmitic acid impacted autophagic flux in GS cells. (A) Accumulation of GFP-LC3 (green) were observed after palmitic acid treatment. GS cells were transfected with C1-EGFP-LC3 plasmid, then incubated with or without 0.4 mM palmitic acid. Cells were fixed with 4% polyformaldehyde and staining with Hoechst33342. Fluorescence was observed under the fluorescence microscope (Zeiss). (B) Representative image of phospho-Akt (Ser473) [p-Akt (ser473)], and phospho-mTOR (p-mTOR) detection was performed to verify Akt and mTOR inhibition by 1% BSA or palmitic acid (0.4 mM) treatment. β-tubulin was used as the internal control. (C) The expression levels of LC3, and p62 in cell lysates were evaluated after the incubation of 1% BSA or palmitic acid (0.4 mM) for 24 h. Western blot assay was carried out, and β-tubulin was used as the internal control. (D) GS cells were incubated with 1% BSA, 0.2 mM palmitic acid, or 0.4 mM palmitic acid for 24 h, and CQ was added for the last 4 h treatment. Western blot assay was carried out to detect the LC3-II and β-tubulin levels in cell lysate. Band intensity was calculated using Image J software, and the LC3-II protein level was presented by the ratio of LC3-II/β-tubulin. (E) Autophagic flux was measured. Briefly, after measuring the LC3-II protein level (LC3-II/β-tubulin) in each group, the histogram was made referring to the ratio of LC3-II level in cells treated with CQ to that of untreated cells. Setting the ratio in 1% BSA treated group as 1-fold. The data are represented as mean ± SD, and the statistical significances were determined with Student's t-test, n = 3. The significance level was defined as *p < 0.05.

