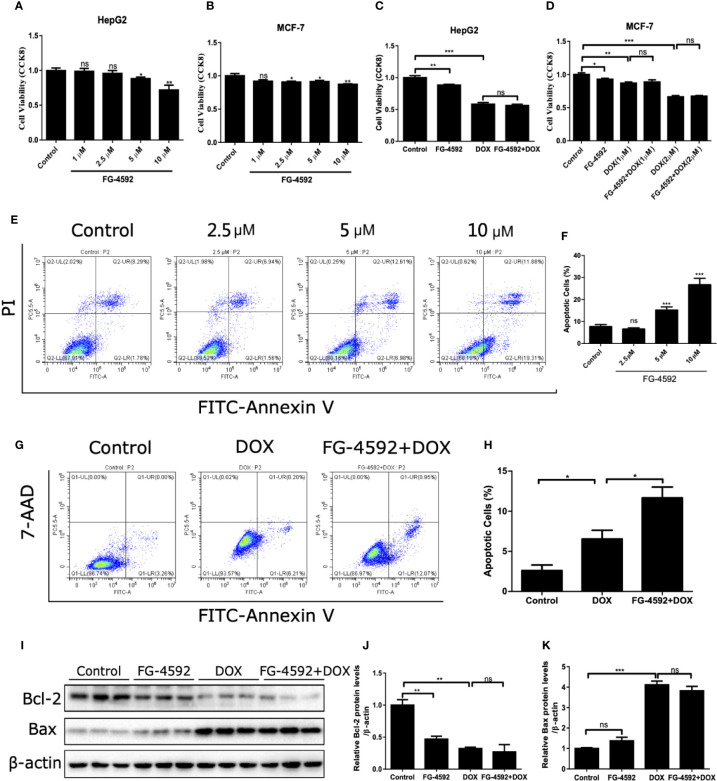
Figure 9.
FG-4592 effect on the antitumor activity of DOX. (A, B) HepG2 and MCF-7 cells were treated with different dose of FG-4592(1, 2.5, 5, 10 μM) for 24 h, Cell viability was detected by CCK-8 assay (n =6 per group). (C) HepG2 cells were pretreated with FG-4592 (5 μM) for 24 h followed by DOX (1 μM) treatment for another 24 h. Cell viability was detected by CCK-8 assay (n =6 per group). (D) MCF-7 cells were pretreated with FG-4592 (5 μM) for 24 h followed by DOX (1 or 2 μM) treatment for another 24 h. Cell viability was detected by CCK-8 assay (n =6 per group). (E) Representative images of FACS analysis for cell apoptosis. HepG2 cells were treated with different doses of FG-4592 (2.5, 5, and 10 μM) for 48 h. (F) Quantification of the percentage of apoptotic cells (n =6 per group). (G) Representative images of FACS analysis for cell apoptosis. HepG2 cells were pretreated with FG-4592 (5 μM) for 24 h followed by DOX (1 μM) treatment for another 24 h. (H) Quantification of the percentage of apoptotic cells (n =3 per group). (I) Expression of Bcl-2 and Bax were examined by immunoblotting analysis. β-actin was used as the loading control. (J, K) Quantitation of the Western blots of Bcl-2 and Bax (n =3 per group). The values were represented as mean ± SED. *P < 0.05, **P < 0.01, and ***P < 0.001.

