
Figure 3.
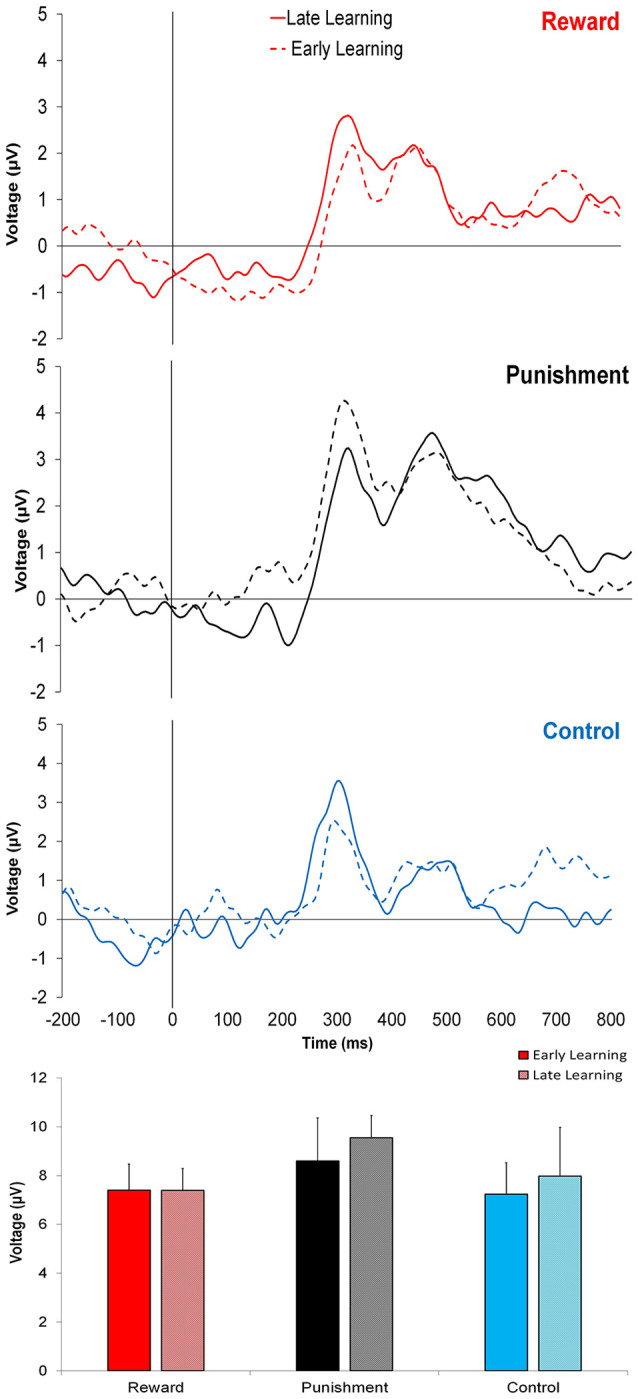
Grand average feedback-related event-related potentials (ERPs) for the three groups at the FCZ electrode during the Adaptation condition, Early Learning (dashed line), and Late Learning (solid line), with zero representing feedback presentation. The bottom bar graph represents the corresponding average ERP amplitude (mean ± standard error) for each group.