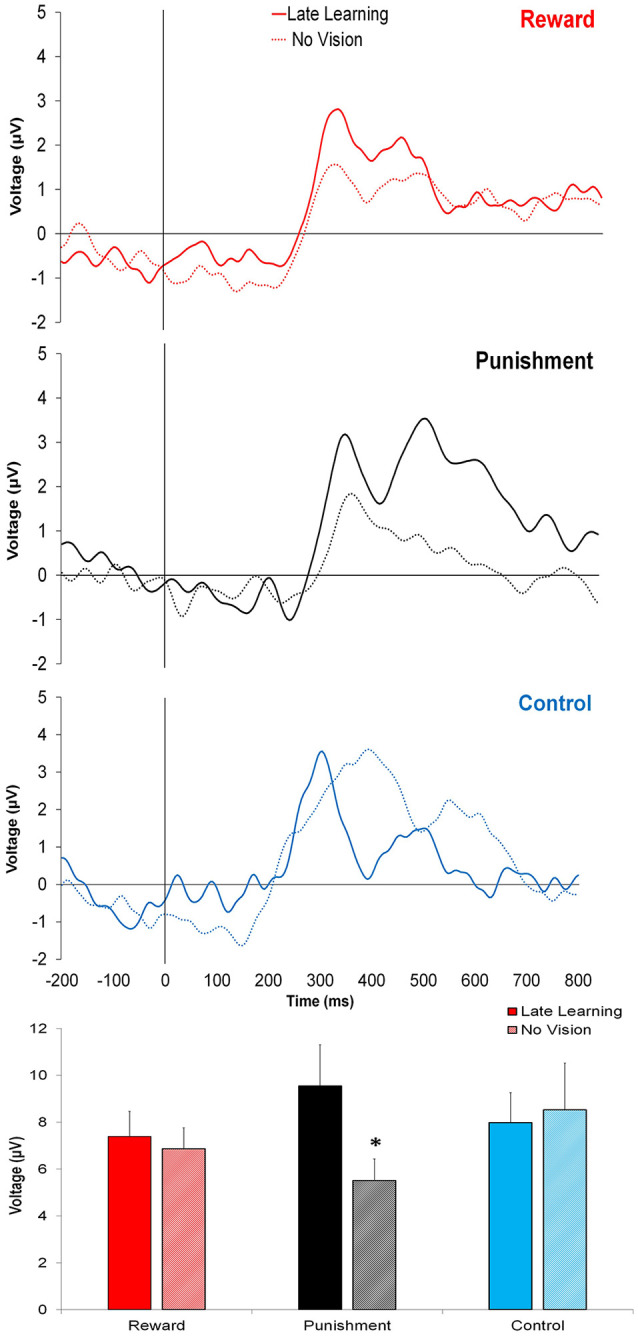
Figure 4.

Grand average feedback-related ERPs for the three groups at the FCZ electrode during Adaptation (Late Learning; solid line) and No Vision (dotted line), with zero representing feedback presentation. The bottom bar graph represents the corresponding average ERP amplitude (mean ± standard error) for each group. *p < 0.05 compared to Late Learning.
