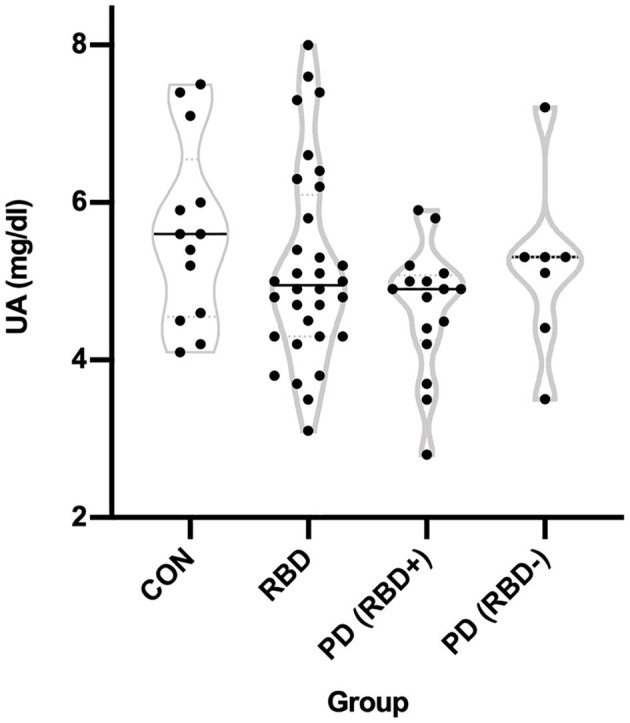
Figure 1.

Distribution of uric acid levels in each group. Measured UA levels in the CON, RBD, PD (RBD+), and PD (RBD–) groups are shown using violin plots where the width of the distribution of points is proportionate to the number of points at a given Y value.
