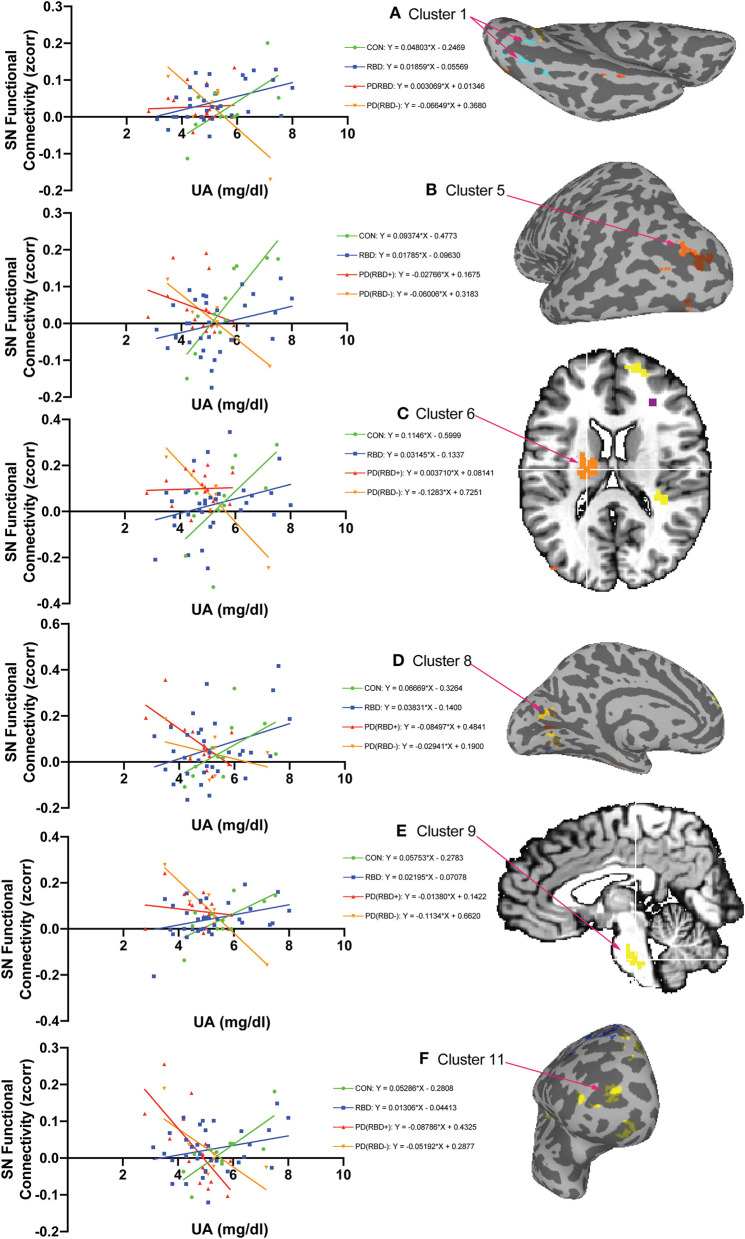
Figure 4.
The group-by-uric acid interaction reveals six brain regions with decreasing SN functional connectivity as a function of uric acid from controls to PD with RBD in between. Of the 15 clusters identified in the ANCOVA interaction F-map, six exhibited a relationship in which CON subjects showed the highest positive regional slope [slope m = 0.04803 in (A) Cluster 1, L. Lingual Gyrus BA 18], the RBD slope was lower [m = 0.01859 in (A) Cluster 1], the PDRBD slope was lower still (m = 0.003069 in (A) Cluster 1], and the PD slope was negative [m = −0.06649 in (A) Cluster 1]. This ordered pattern of decreasing slopes across these groups is similar in the other clusters: cluster 5 (B), cluster 6 (C), cluster 8 (D), cluster 9 (E), and cluster 11 (F). Slopes are computed using the average of voxels in each cluster in each subject. Cluster numbers are the same as in Table 3C. The color of cluster voxels in the inflated and orthogonal views is arbitrary.

