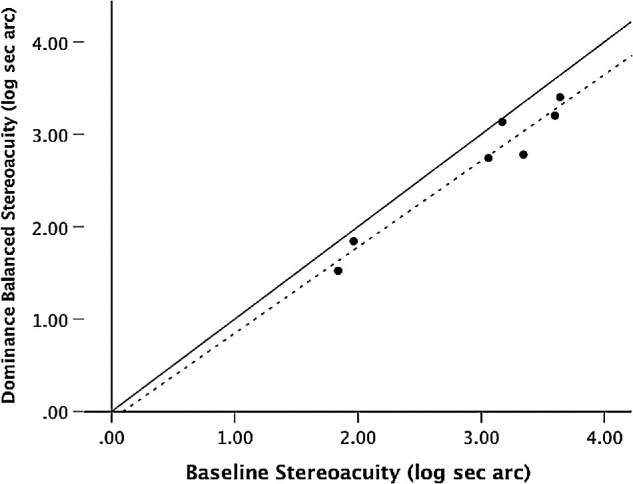
Figure 4.

Threshold stereoacuity before versus after interocular balance adjustment based on individual CR. The dashed line is the best-fit line for the data. Points that lie on the solid unity line indicate no change in threshold. All points that lie below the unity line represent improved stereoacuity when dominance balance is altered.
