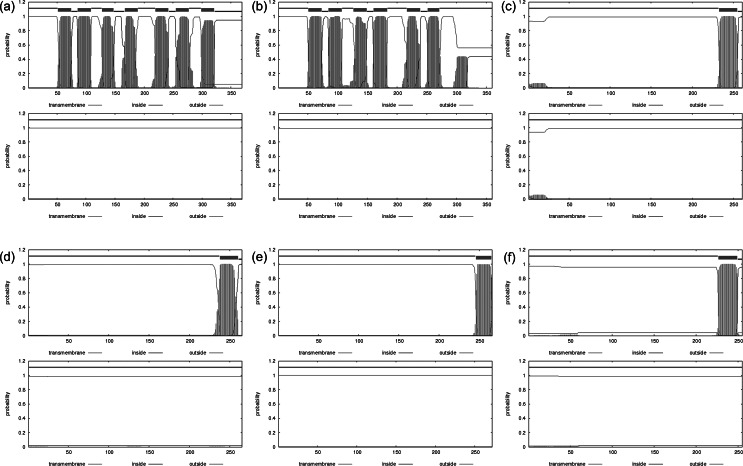
Fig. 3.
Bioinformatic predictions of cytokine receptors with hydrophobic segment of native (top) and QTY variant (bottom). The hydrophobicity probability of a protein is plotted vs the sequence. (a) CCR9QTY–Fc; (b) CXCR2QTY–Fc; (c) IL4RαQTY–Fc; (d) IL10RαQTY–Fc; (e) IFNγR1QTY–Fc and (f) IFNλR1QTY–Fc. Color code: pink line, extracellular regions; red line, transmembrane regions and blue line, intracellular region.

