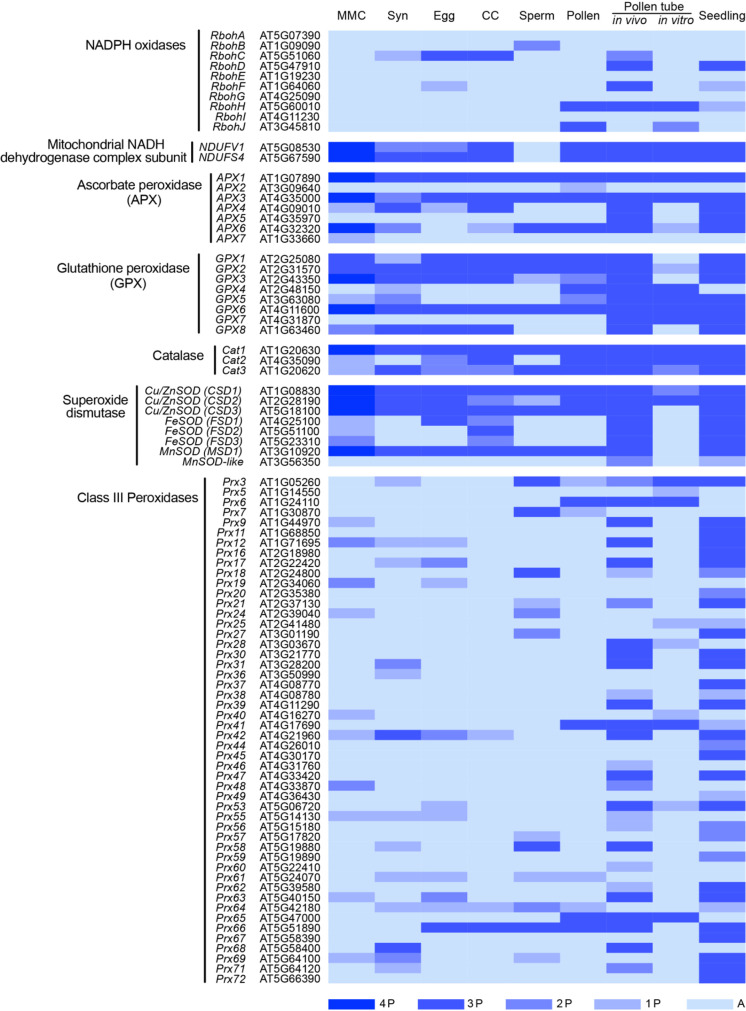
Table 1.
Annotation and expression of ROS production and scavenging genes in Arabidopsis reproductive cells.
The darkness of blue color indicates the likelihood of gene expression based on the number of experimental replicates with a present (P) call. 4 P, presence in four replicates; 3 P, presence in three replicates; 2 P, presence in two replicates; 1 P, presence in one replicate; A, absence of expression; MMC, megaspore mother cell; Syn, synergid; CC, central cell. Note that the total replicates for MMC are 4, and the total replicates for the rest cell types are 3. These data were compiled using the gene expression data obtained from Schmidt et al., 2011 (transcriptome), Wuest et al., 2010 (transcriptome), and Lin et al., 2014 (translatome).

