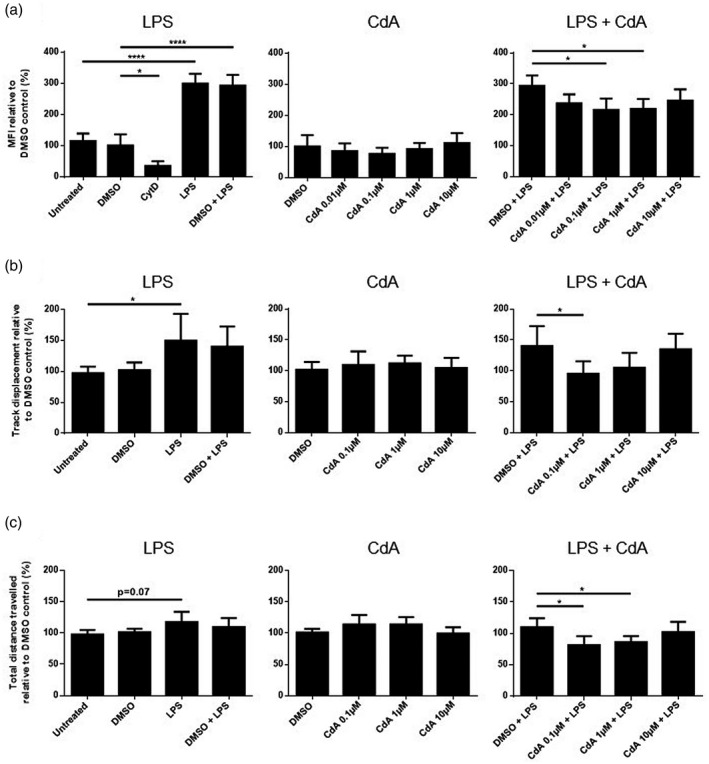
Fig. 3.

The effect of cladribine on the phagocytotic ability and random migration of microglia. (a) Phagocytosis was quantified after microglia were treated with dimethylsulfoxide (DMSO) (0·2%), lipopolysaccharide (LPS) (10 ng/ml), DMSO and LPS, different concentrations of cladribine (CdA) (0·01 μM, 0·1 μM, 1 μM and 10 μM), and different concentrations of CdA together with LPS for 24 h. Fluorescent latex beads were added to the cell media for 40 min. As negative control, microglia were treated with cytochalasin D (5 μg/ml) for 30 min before addition of latex beads. The cells were analyzed by flow cytometry, and the phagocytotic ability was quantified by mean fluorescent intensity (MFI) and presented relative to DMSO control. (b) Track displacement was quantified by analysis of timelapse videos using TrackMate after microglia were treated with DMSO (0·2%), LPS (10 ng/ml), DMSO and LPS, different concentrations of CdA (0·1 μM, 1 μM and 10 μM) and different concentrations of CdA together with LPS for 24 h. The results are shown relative to DMSO control. (c) Total distance travelled was quantified by analysis of timelapse videos using TrackMate after microglia were treated with DMSO (0·2%), LPS (10 ng/ml), DMSO and LPS, different concentrations of CdA (0·1 μM, 1 μM and 10 μM) and different concentrations of CdA together with LPS for 24 h. The results are shown relative to DMSO control. *P ≤ 0·05, ****P ≤ 0·0001, n = 3–5 in each group, one‐way analysis of variance (ANOVA) followed by multiple comparison tests, mean ± standard deviation (s.d.).
