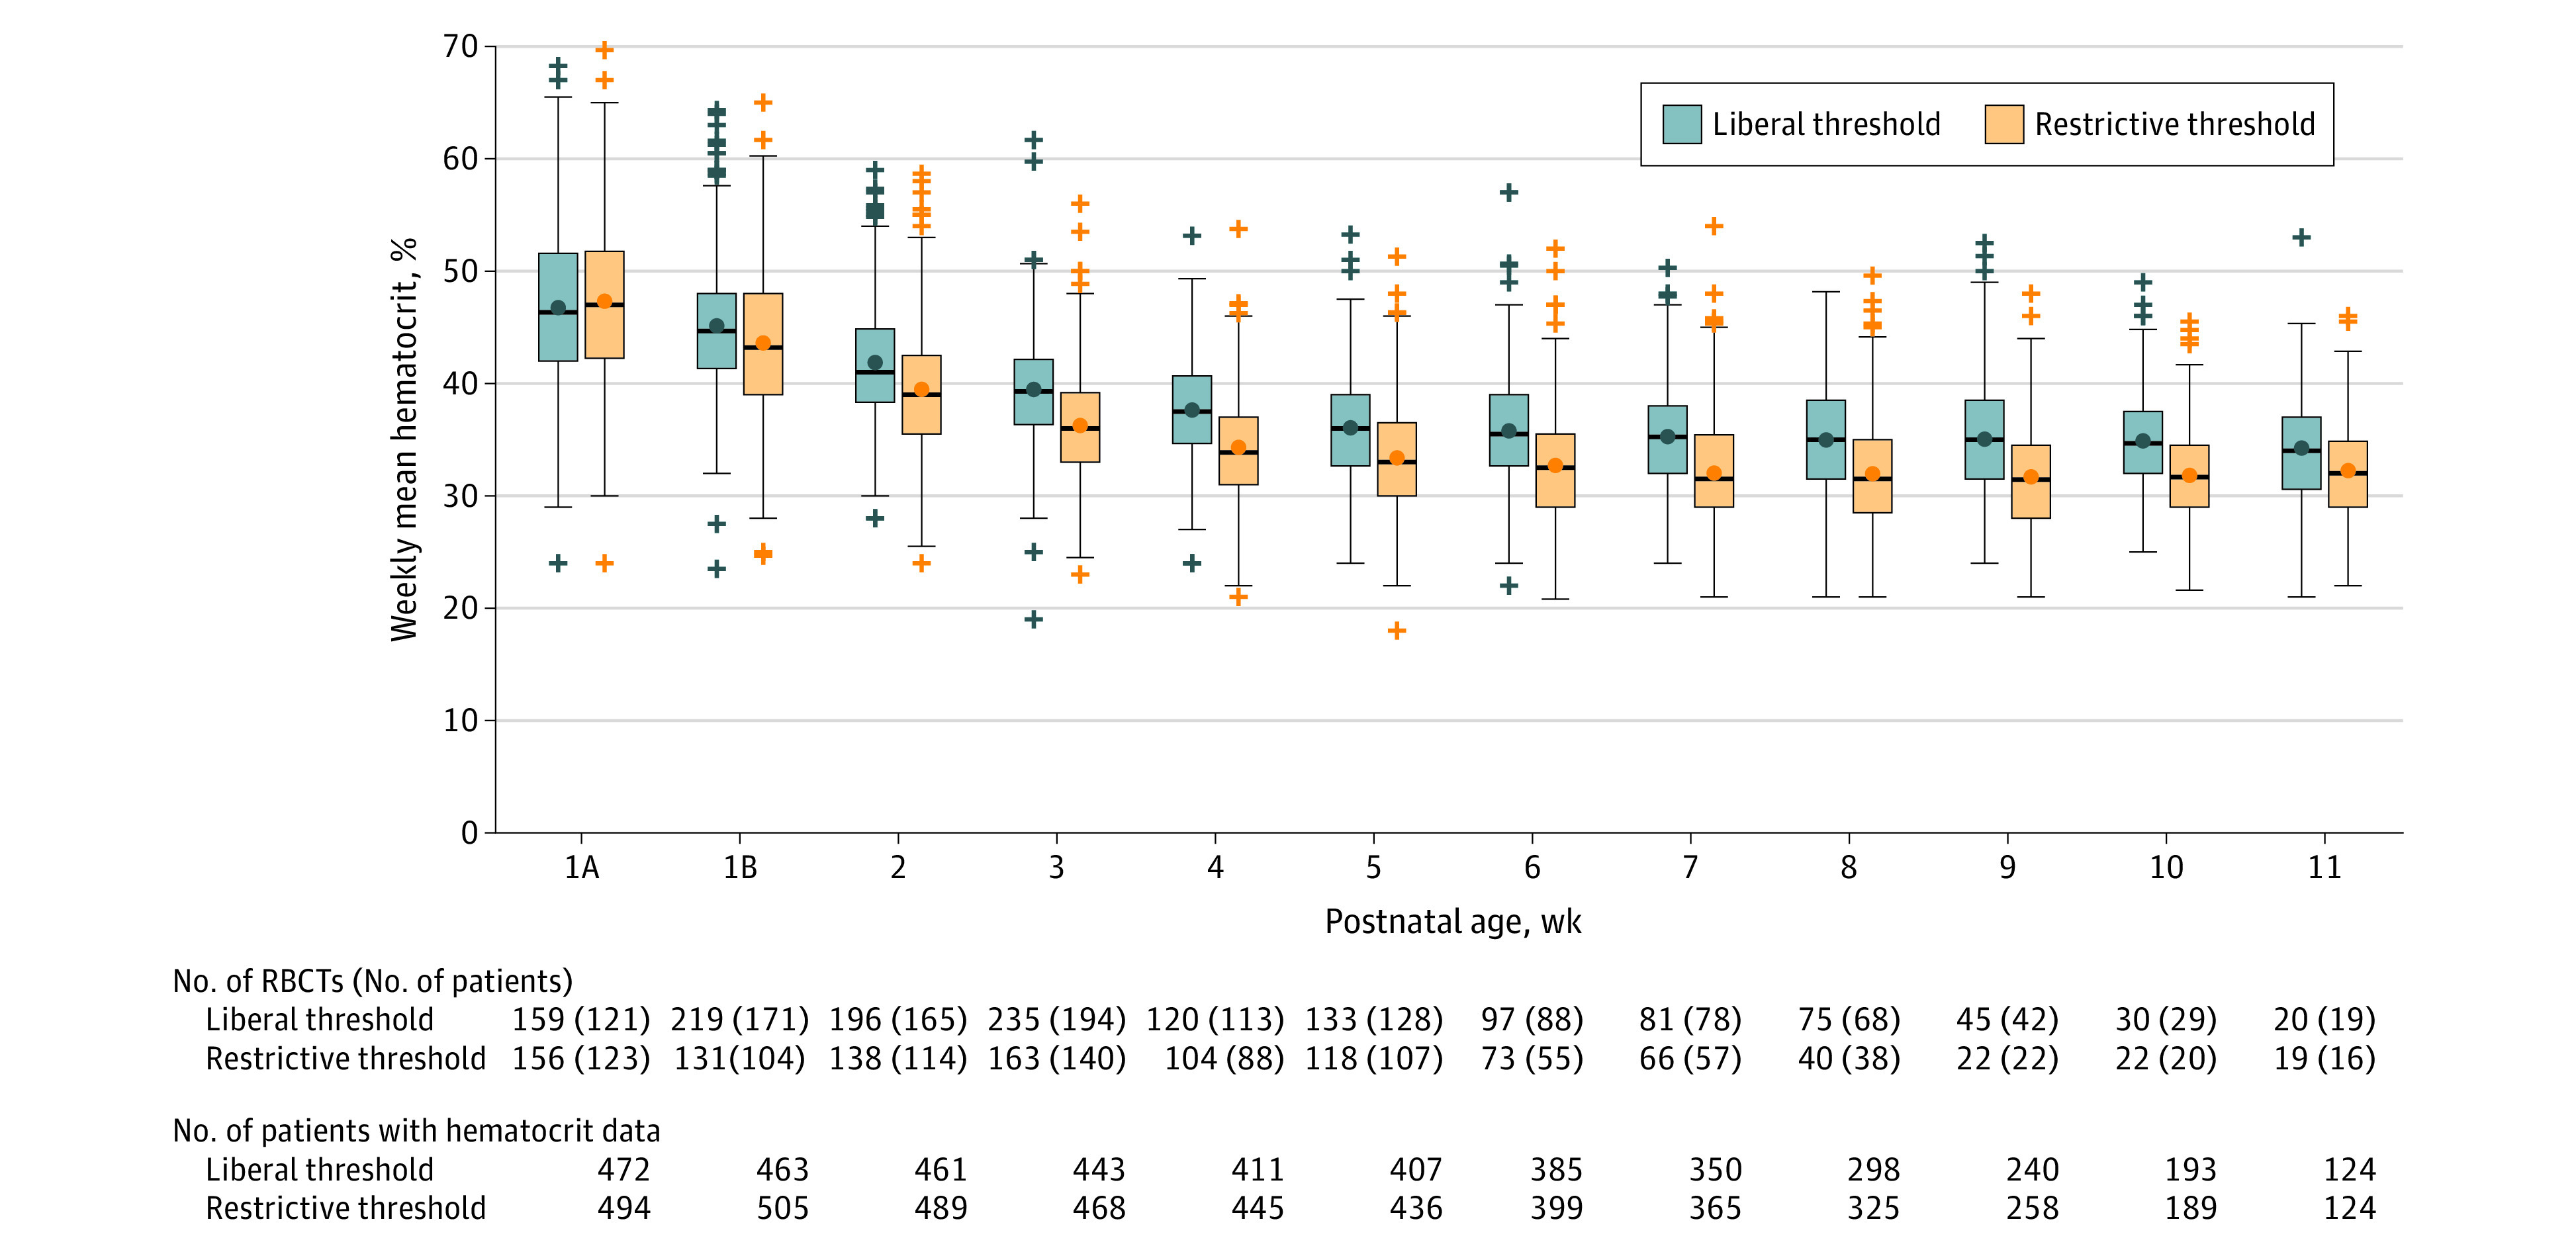
Figure 2. Treatment Effect on Hematocrit and Number of Red Blood Cell Transfusions (RBCTs).

Weekly mean hematocrit values (limited to hematocrit values documented until 36 weeks of postmenstrual age and truncated when less than 20% of the population remained, ie, at 11 weeks of postnatal age). Week 1A refers to the days of the first week of postnatal age up to randomization and week 1B refers to the days of the first week of postnatal age after randomization. Hematocrit values were derived from clinically indicated complete blood cell counts (or, rarely, from centrifuged hematocrit capillaries), documented as observed. Hematocrit values of 36 patients at 4 centers were at least in part estimated from hemoglobin concentrations. For each week, a mean value of all documented hematocrit values was calculated, resulting in a weekly mean hematocrit for each infant who had ≥1 hematocrit measurement in that week. Boxes indicate interquartile ranges; bars inside the boxes, medians; circles inside boxes, means; whiskers, highest and lowest values within 1.5 times the interquartile range; and markers outside the boxes, outlying data. Weekly mean hematocrit values are significantly different between the treatment groups from week 1b through week 11. See eTable 6 in Supplement 2 for differences in means; see eFigure 3 in Supplement 2 for weekly mean hematocrit values in the per-protocol population.
