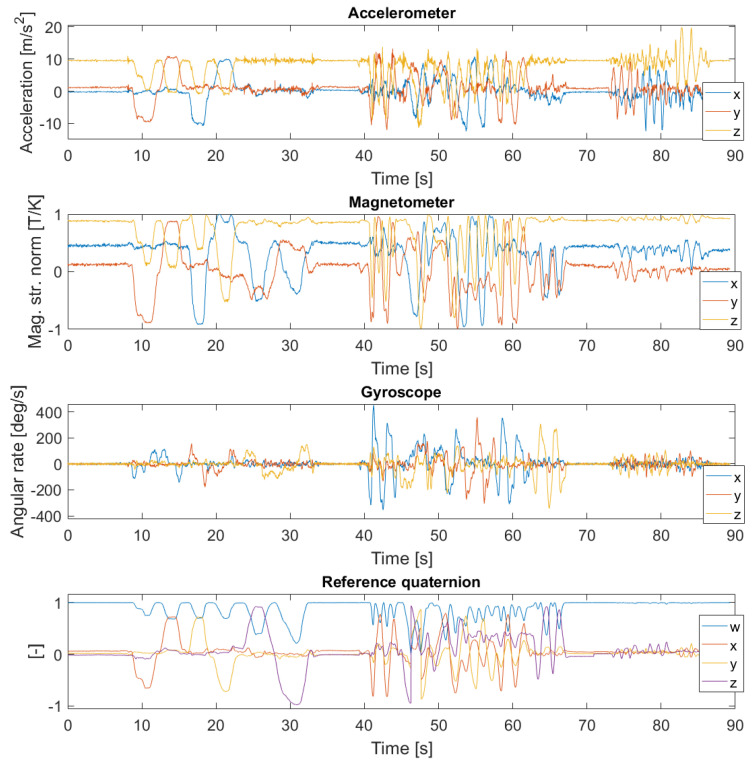
Figure 4.
The measured data from all three experiments. The first three rows display data from the MARG sensor: all three axes, , of the accelerometer, magnetometer, and gyroscope, respectively. The measured positions of the points on the platform from the VICON system were converted to the reference quaternion that is displayed via its vector components, (3) in the bottom row. The slow rotations occur between 0–40 s, fast rotations between 40–72 s, and dynamic accelerations after 72 s.

