Figure 1.

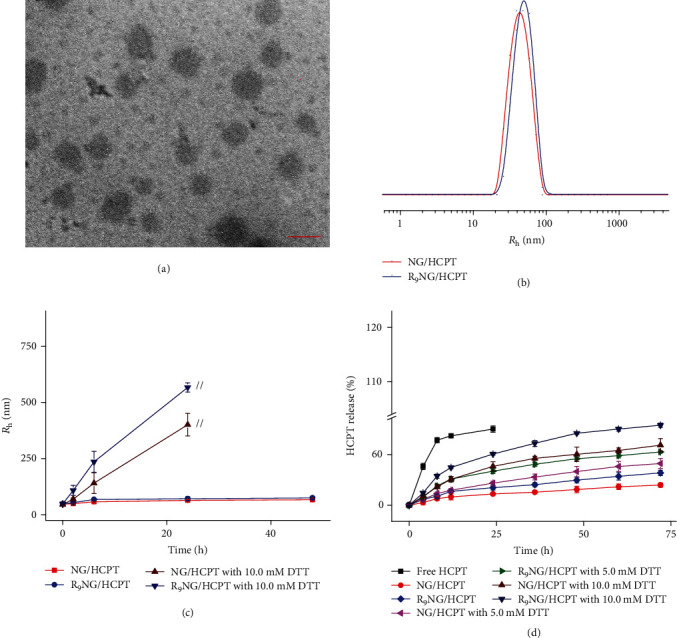
Characterizations of R9NG/HCPT. (a) Morphologies of R9NG/HCPT in PBS by TEM. (b) Rh of R9NG/HCPT in PBS. (c) Stability of R9NG/HCPT in PBS without or with 10.0 mM DTT versus time. The scale bar in (a) represents 100 nm. // represents the interruption of Rh-related light-scattering signal. (d) In vitro release profiles of R9NG/HCPT. All the statistical data are represented as mean ± standard deviation (n = 3).
