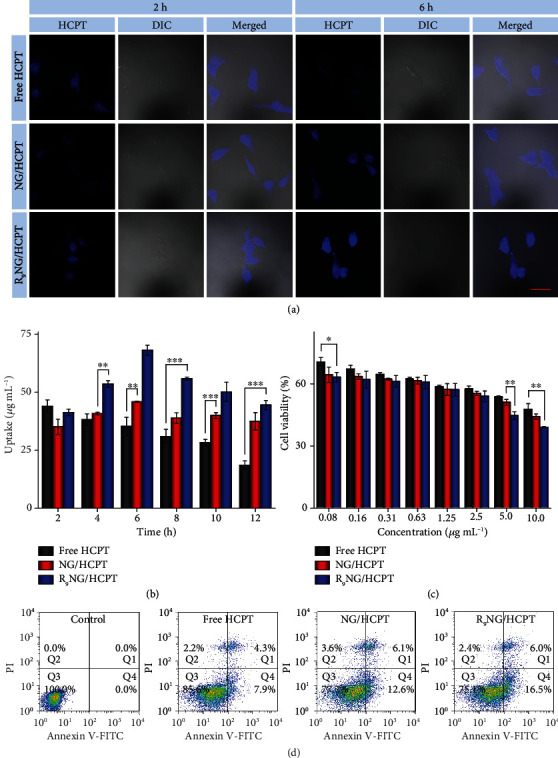
Figure 2.

In vitro cell uptake and cytotoxicity. (a) Representative CLSM images of human BC 5637 cells incubated with free HCPT, NG/HCPT, or R9NG/HCPT for 2 or 6 h. The blue color was HCPT fluorescence in cells (left). Differential interference contrast (DIC) was used to obtain the bright-field images (middle), and the merged images were shown on the right. The scale bar represents 50 μm. (b) Intracellular HCPT release profiles in human BC 5637 cells after co-incubation with free HCPT, NG/HCPT, or R9NG/HCPT. Data are presented as mean ± standard deviation (n = 3; ∗P < 0.05, ∗∗P < 0.01, and ∗∗∗P < 0.001). (c) The viability of human BC 5637 cells incubated with free HCPT, NG/HCPT, or R9NG/HCPT at different concentrations for 24 h. Data are presented as mean ± standard deviation (n = 3; ∗P < 0.05, ∗∗P < 0.01). (d) Apoptotic cell populations were calculated by FCM analysis after co-incubating human BC 5637 cells with PBS as a control, free HCPT, NG/HCPT, or R9NG/HCPT for 24 h. The lower-left (Q3), lower-right (Q4), upper-right (Q1), and upper-left (Q2) quadrants in each panel indicated the populations of healthy, early and late apoptotic, and necrotic cells, respectively.
