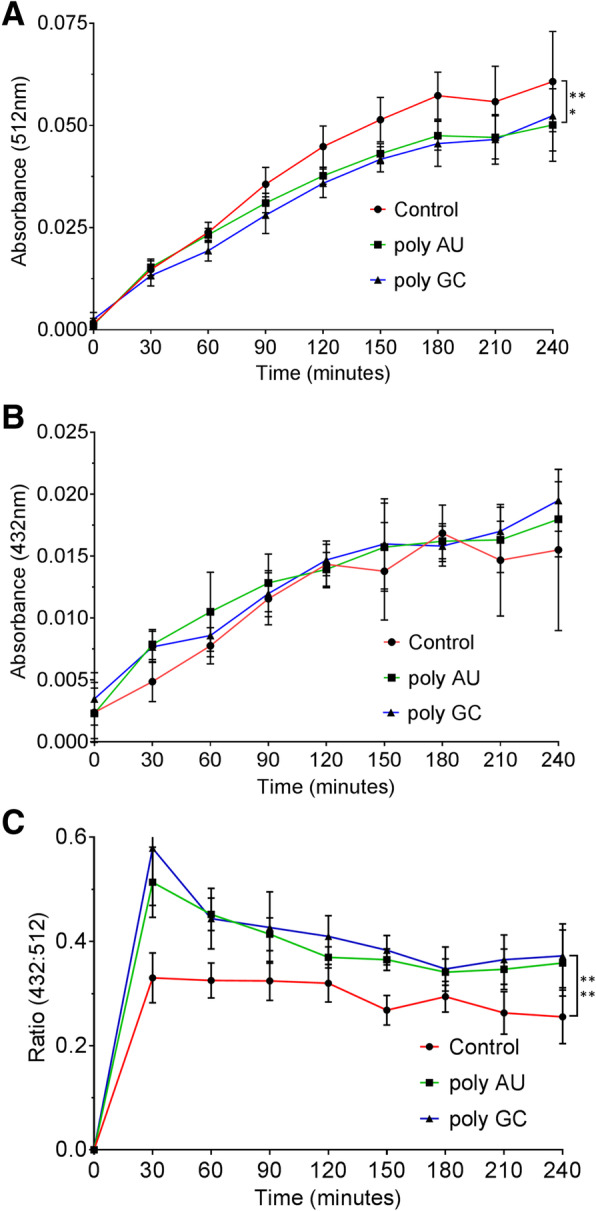
Fig. 5.

Thermal equilibrium analysis of the MC-dsRNA interaction. a and b Changes in absorbance at 512 nm (a) or 432 nm (b) for the three samples (control, poly-AU, and poly-GC) in 9 mM of Na + ion buffer at pH 7. Samples are kept in dark throughout the experiment. c The ratio in the absorbance peak at 432 to 512 nm for the three samples. Averages of three replicates are plotted with error bars indicating s.e.m. Statistical tests show that at equilibrium, the absorbance at 512 nm and the corresponding ratios for poly GC (p = 0.0138) and poly AU (p = 0.0024) were significantly different from that of the control
