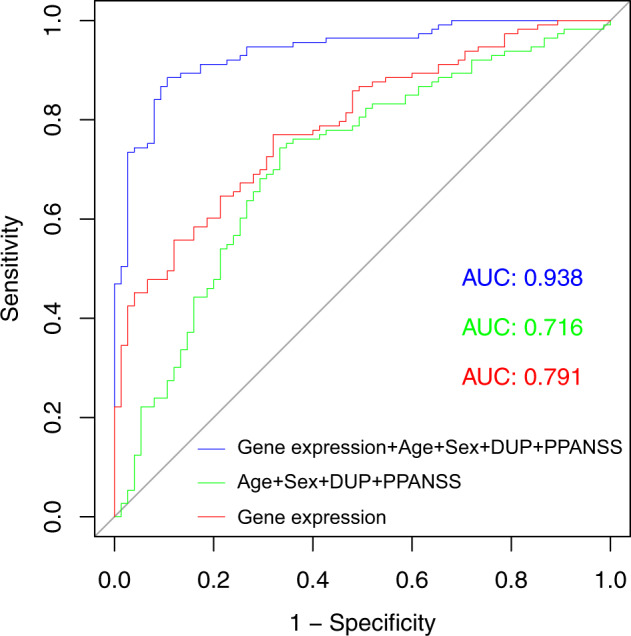
Fig. 2. Receiver operator characteristic curves from logistic regression models predicting good or poor response to amisulpride treatment.

The red curve represents the model combining the gene expression level of ALPL, CA4, DGAT2, DHRS13, HOMER3 and WLS. The green curve represents the model combining the age, the sex, the positive PANSS score (PPANSS) and the duration of untreated psychosis (DUP). The blue curve represents the model combining the ALPL, CA4, DGAT2, DHRS13, HOMER3 and WLS gene expression level as well as the age, the sex, the PPANSS and the DUP at inclusion. Area under the curve (AUC) are indicated for each model.
