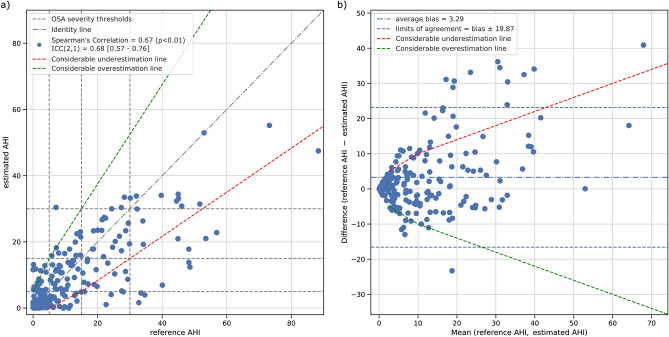
Figure 2.
Analysis of the estimated AHI performance after removal of low-quality rPPG recordings. (a) Correlation between reference AHI versus estimated AHI; dashed lines delimit the canonical OSA severity classes and the dash-dotted line is the identity line. (b) Bland–Altman plot of the reference AHI and estimated AHI. The bias and the limits of agreement (i.e. 1.96 times the standard deviation of the difference) are shown as events/h. The red and the green dashed lines represent, respectively, the boundaries to define considerable under- and overestimations.

