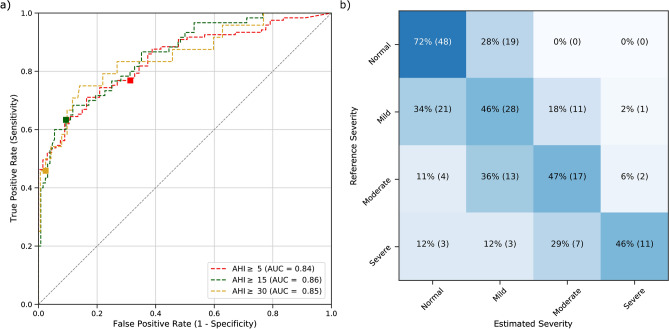
Figure 3.
Receiver operating characteristics and confusion matrix of the estimated for the three canonical AHI thresholds after removal of low-quality rPPG recordings. (a) AUC area under each curve; square markers indicate the points in the curve where the estimated AHI threshold for severity classification is equal to the canonical 5, 15 and 30 events/h. (b) OSA severity classes obtained from the AHI (reference severity) and estimated AHI (predicted severity) using the canonical thresholds. In each cell, the percentage per severity is shown (also visually indicated by the color scale) as well as the number of participants.

