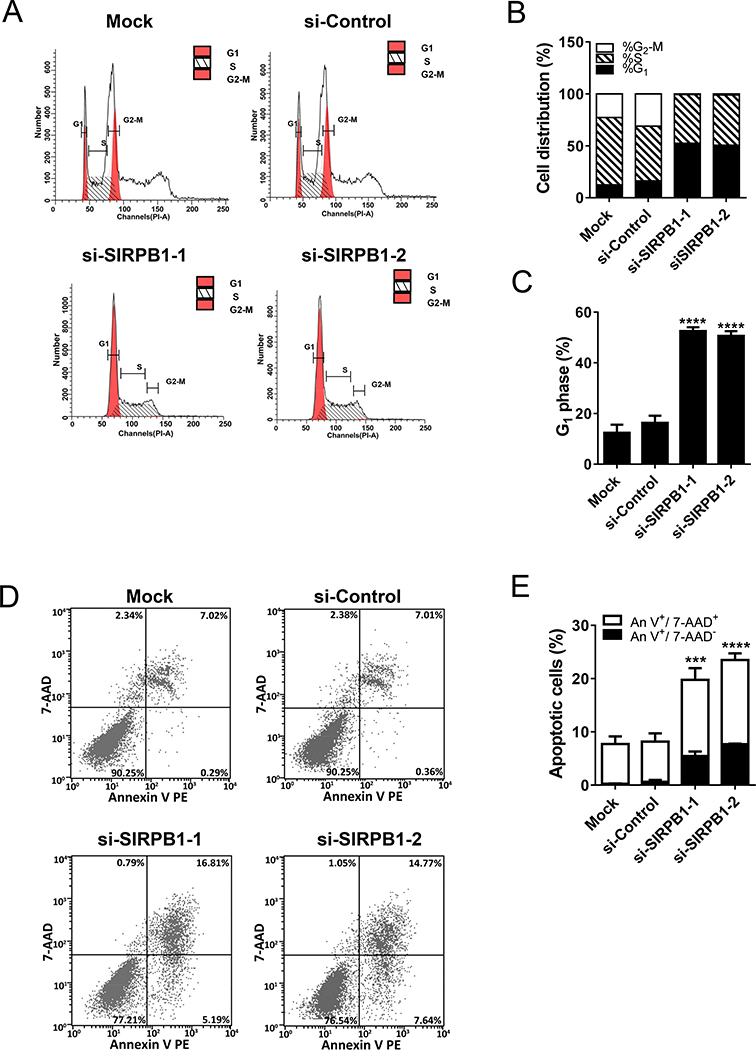
Fig. 3.
PC3 cells transfected with control or SIRPB1 siRNA or mock control as indicated were analyzed 72 h post-transfection by flow cytometry. A. Cell number versus propidium iodide fluorescence intensity. B. Percentage of cells in each cell-cycle phase estimated from flow cytometry analysis. C. Percentage of cells in G1 phase. D. Apoptotic cells of PC3 cells detected by flow cytometry. E. Percentage of early (Annexin V+/7AAD-) and late apoptotic PC3 cells (Annexin V+/7AAD-) based on flow cytometry analysis. Images are representative three independent studies. Data are presented as mean ± SD. ***P<0.001, and ****P<0.0001 when the data were compared to the control groups.

