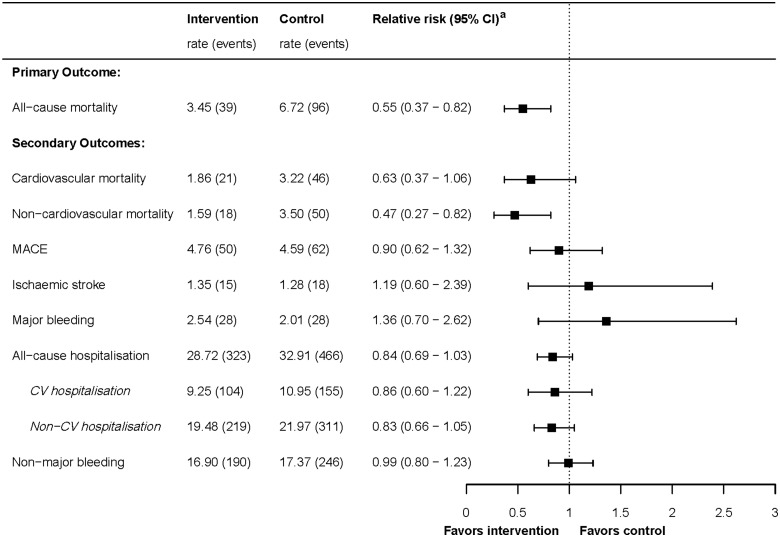
Figure 2.
Forest plot of Cox regression analyses of primary and secondary outcomes, and recurrent events analyses of hospitalization and clinically relevant non-major bleeding. Rates are incidence rates per 100 person-years. aRelative risks are adjusted hazard ratios, except for the recurrent events hospitalizations and clinically relevant non-major bleeding which are adjusted incidence rate ratios (adjusted for age, sex, frailty index, and accounted for clustering). CV, cardiovascular.

