
Figure 3.
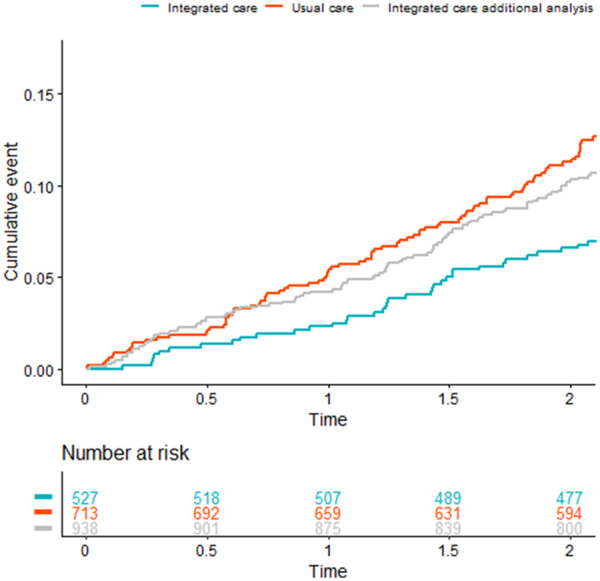
Cumulative event plot all-cause mortality. The red and blue lines represent the cumulative events for all-cause mortality of the 713 patients in the usual care arm and the 527 patients who gave informed consent in the intervention arm, respectively (main analysis). The grey line represents the integrated care arm when including also the 411 patients who did not sign informed consent to participate in the intervention (additional analysis).