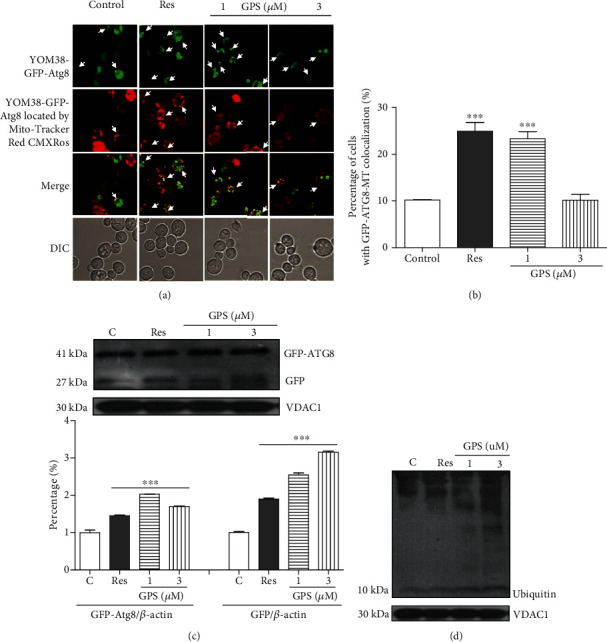
Figure 3.

Effect of GPS on mitophagy in yeast. (a) Fluorescent images of YOM38 yeast containing plasmid pR316-GFP-Atg8 after treatment of GPS through MitoTracker Red CMXRos staining. (b) The percentage of YOM38 cells containing plasmid pR316-GFP-Atg8 with the colocation of autophagosome (green) and MitoTracker Red CMXRos (red). (c, d) The changes in ATG8-GFP, free GFP, and ubiquitin at the protein level in the mitochondria after treatment of GPS. Three pictures containing more than 60 cells in each group are used for statistical analysis.
