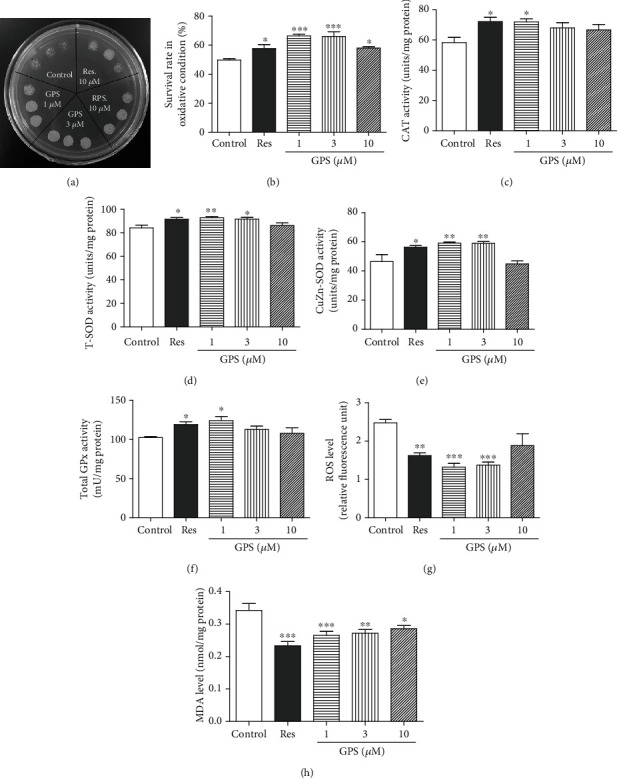
Figure 5.

Effect of GPS on the survival rate of yeast under oxidative stress condition and antioxidative enzyme activity in yeast. (a) Photograph of yeast growth after treatment of GPS under oxidative stress condition induced by H2O2 at 10.5 mM. (b) The survival rate changes in yeast under oxidative conditions at 5 mM H2O2. (c–f) The changes in CAT, T-SOD, SOD1, and GPx enzyme activities in yeast after treatment of GPS for 48 h. (g, h) Effect of GPS on ROS and MDA levels. Each experiment is repeated thrice. ∗, ∗∗, and ∗∗∗ indicate significant differences from the corresponding control (p < 0.05, p < 0.01, and p < 0.001), respectively.
