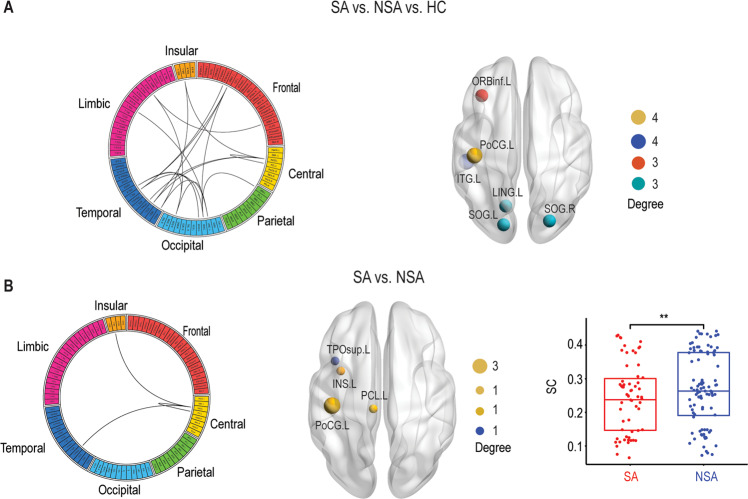
Fig. 1. Structural connectivity (SC) differences.
a The structural connectome network differences between SA, NSA, and HC identified by NBS. A link in the circular plot represents a significantly different connection. The most involved nodes (degree ≥ 3) are shown on the right panel, in which the size of the node corresponds to the number of significant connections. b Similar to a but between SA and NSA. Bar plots showing mean connectivity obtained within the significant network for SA and NSA. There was a significant difference between these two groups (p < 0.01). **P < 0.01. SA suicide attempt, NSA non-suicide attempt, HC healthy controls.

