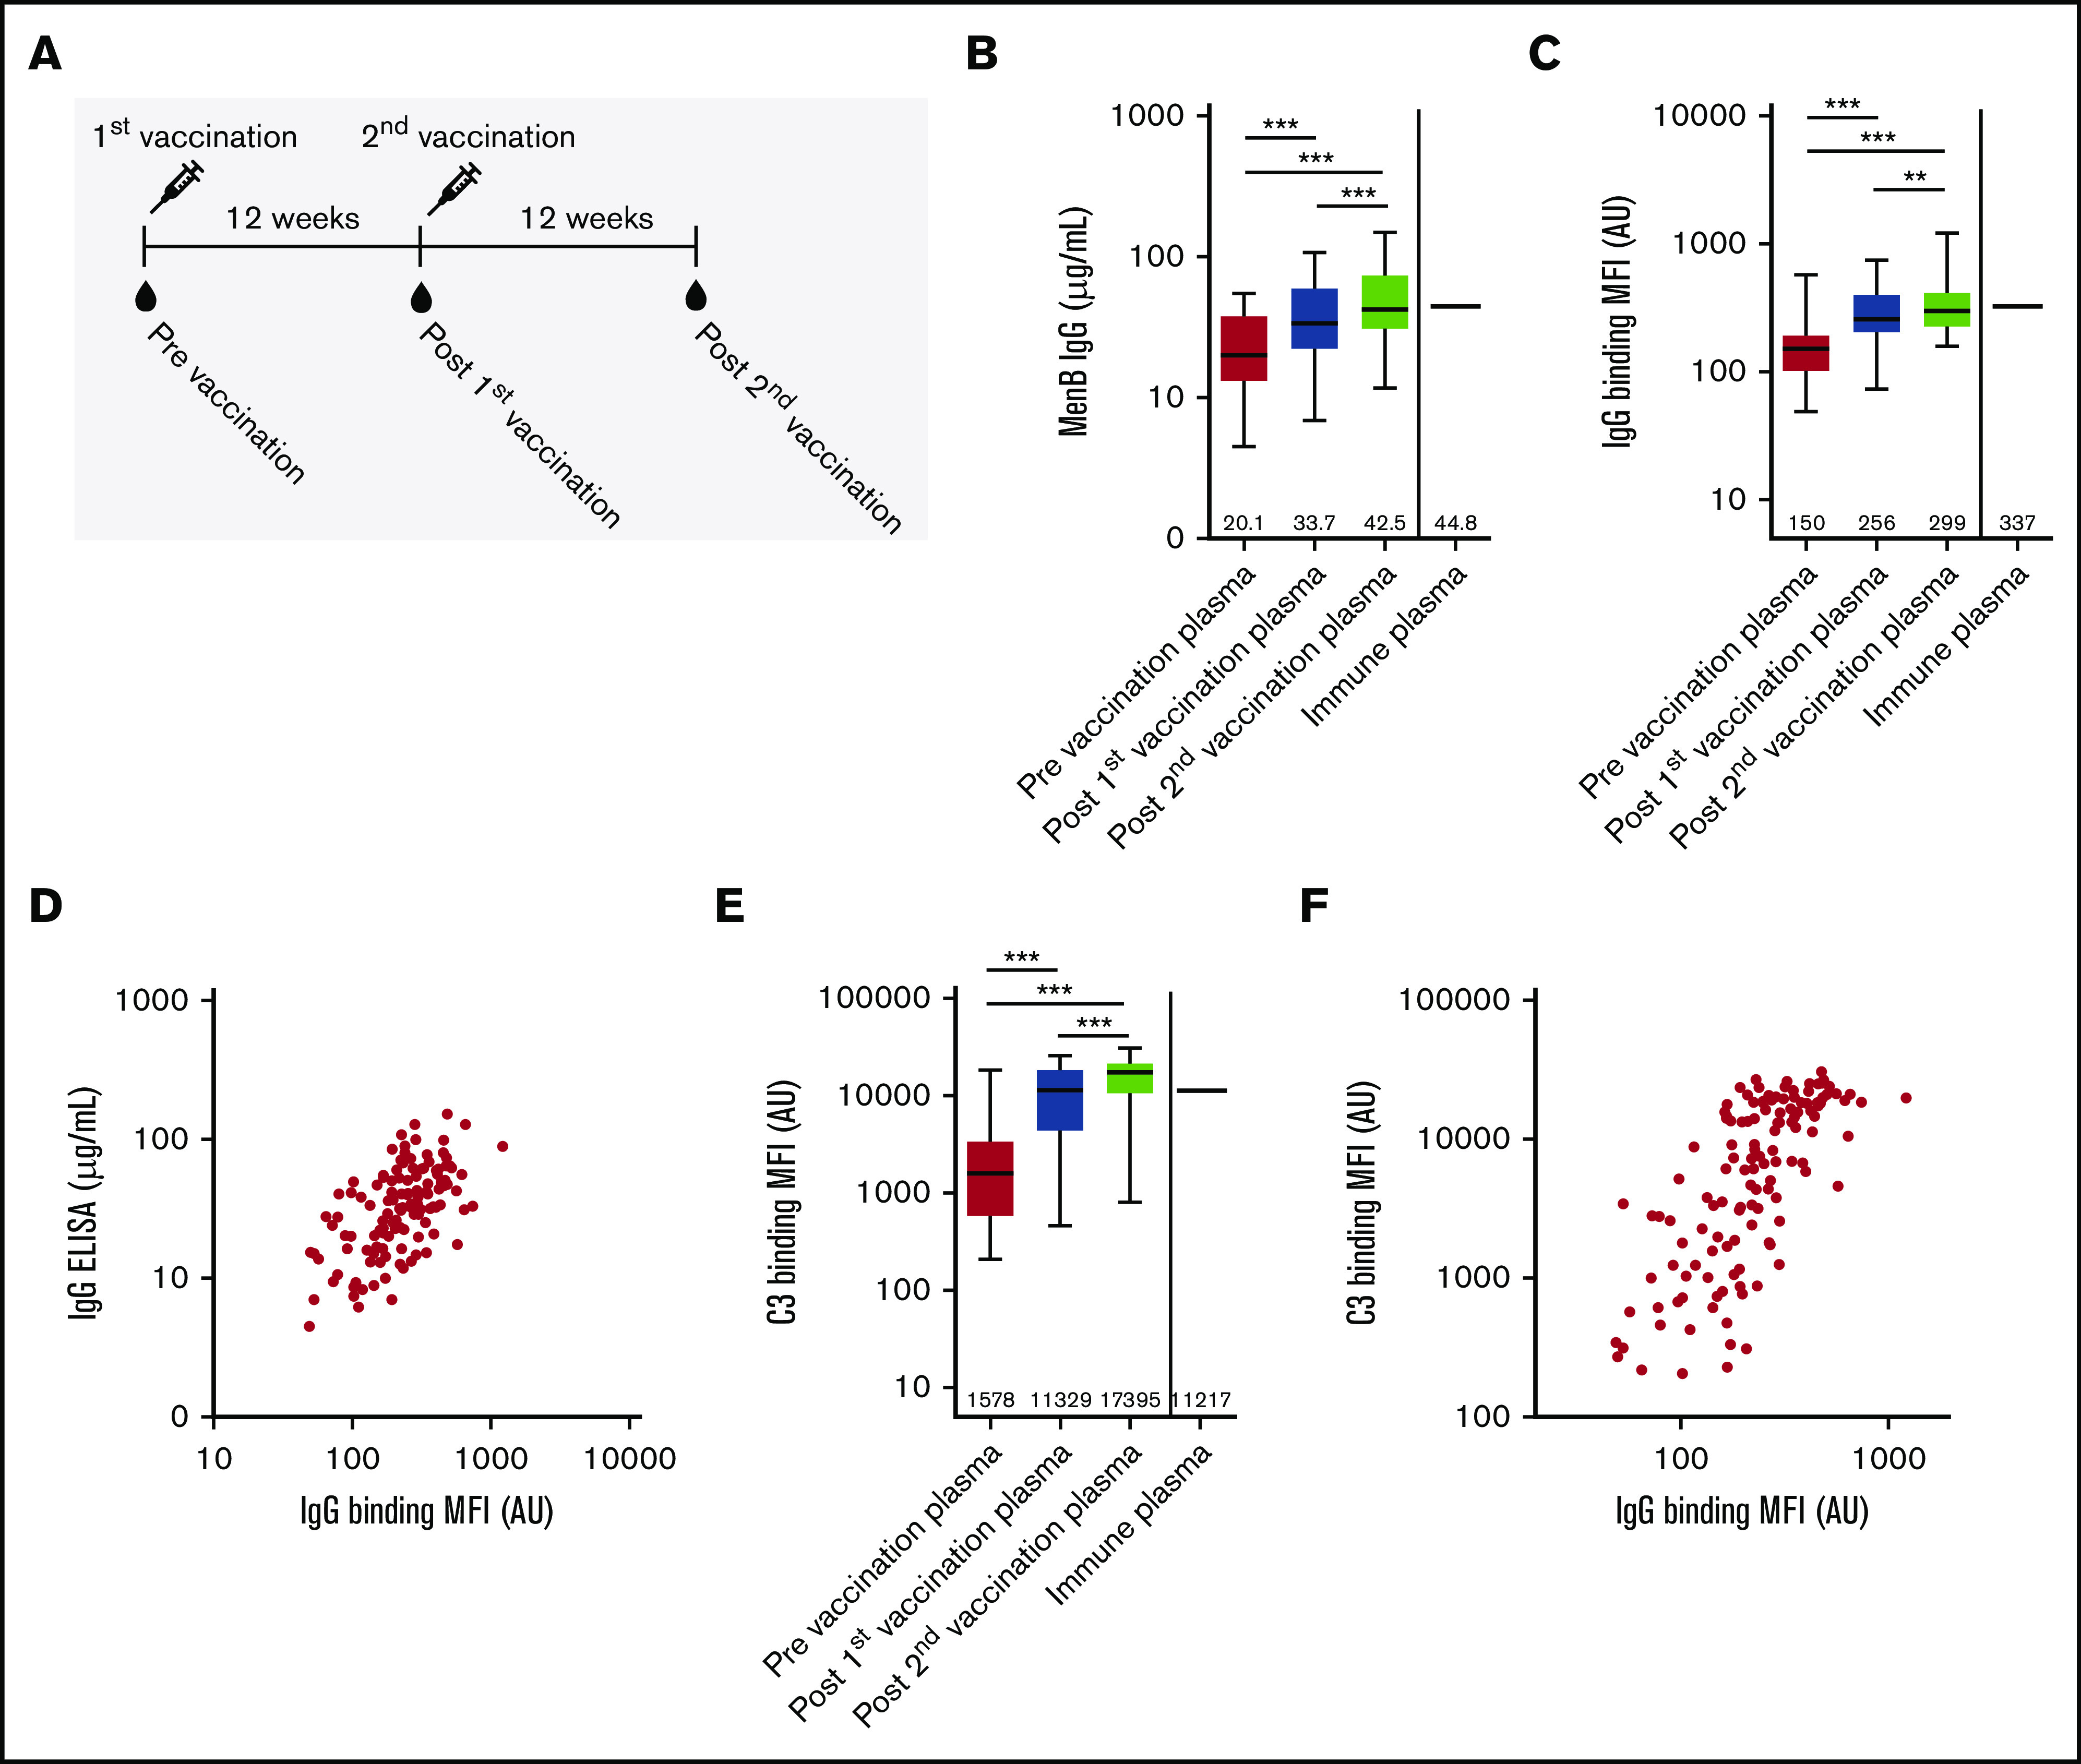
Figure 1.

Characterization of functional antibody responses induced by 4CMenB vaccination. (A) Schematic representation of vaccinations and blood draws. MenB IgG level (B), IgG binding to the bacterial surface of MenB (C), and complement C3 binding to the bacterial surface of MenB (D) using PNH patient plasma from before and after the first and second 4CMenB vaccinations and immune plasma from healthy individuals. Figures show boxplots with minimum/maximum whiskers; horizontal lines and values indicated in the figures are medians. Spearman correlation for IgG binding to the bacterial surface with MenB IgG concentration in serum (r = +0.5865; P < .0001) (E) and C3 binding to the bacterial surface (r = +0.7217; P < .0001) (F). Statistical analyses were performed with Prism version 5.03 for Windows (GraphPad Software, La Jolla, CA). Repeated measures analysis of variance with Tukey’s posttest was used to determine statistical significance. **P < .01, ***P < .001. AU, arbitrary unit; MFI, median fluorescence intensity.
