Fig. 4.
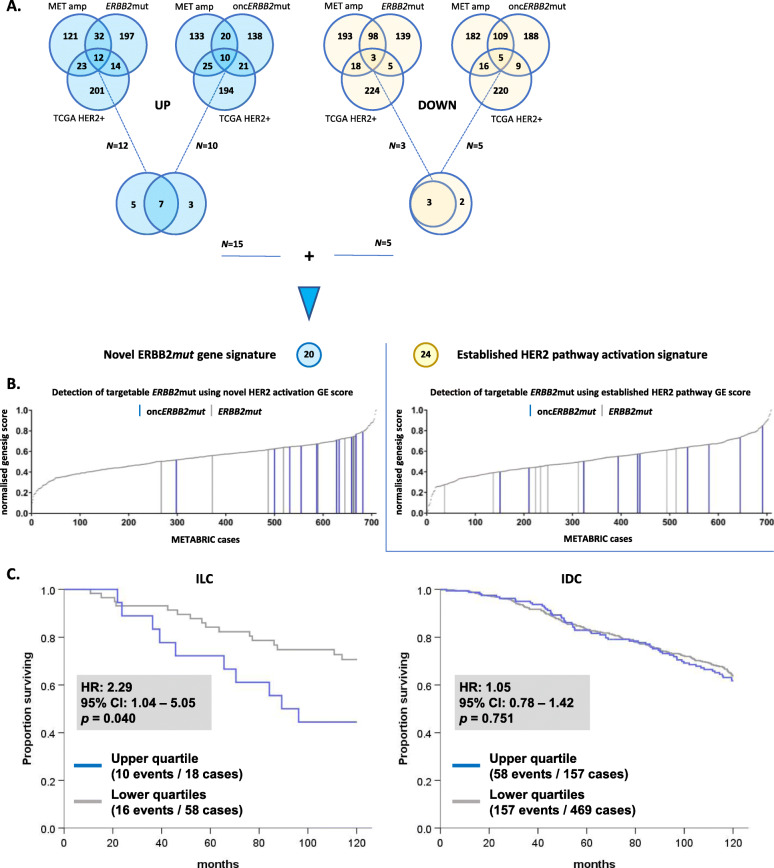
A novel gene signature of HER2 activity incorporating ERBB2mut, ERBB2 amplification, and clinical HER2 status. a Generation of a 20-gene signature of HER2 activity. The upper Venn diagrams show the overlap between the top 500 DEGs by WAD score for METABRIC amplified vs. non-amplified, ERBB2 mutant vs. wild-type, and TCGA HER2+ vs. HER2−. Upregulated DEGs are shaded blue and down-regulated DEGs yellow. ERBB2mut and oncERBB2mut vs. wild-type are analyzed separately, and the overlap combined in the lower Venn diagrams. b Comparison with an established 24-gene signature of HER pathway activation [31], using a gene signature (genesig) score derived from multivariate analysis of response to neratinib in breast cancer cell lines. Cases with ERBB2mut (gray lines) and oncERBB2mut (blue lines) clustered in the upper quartile of normalized genesig scores for the novel signature but not the established signature. c 10-year OS analysis of cases in the current study stratified by histological subtype and novel genesig score (upper vs. lower quartiles) indicates that ERBB2mut-associated DEGs are prognostic in ILC but not IDC. GE, geneset enrichment

