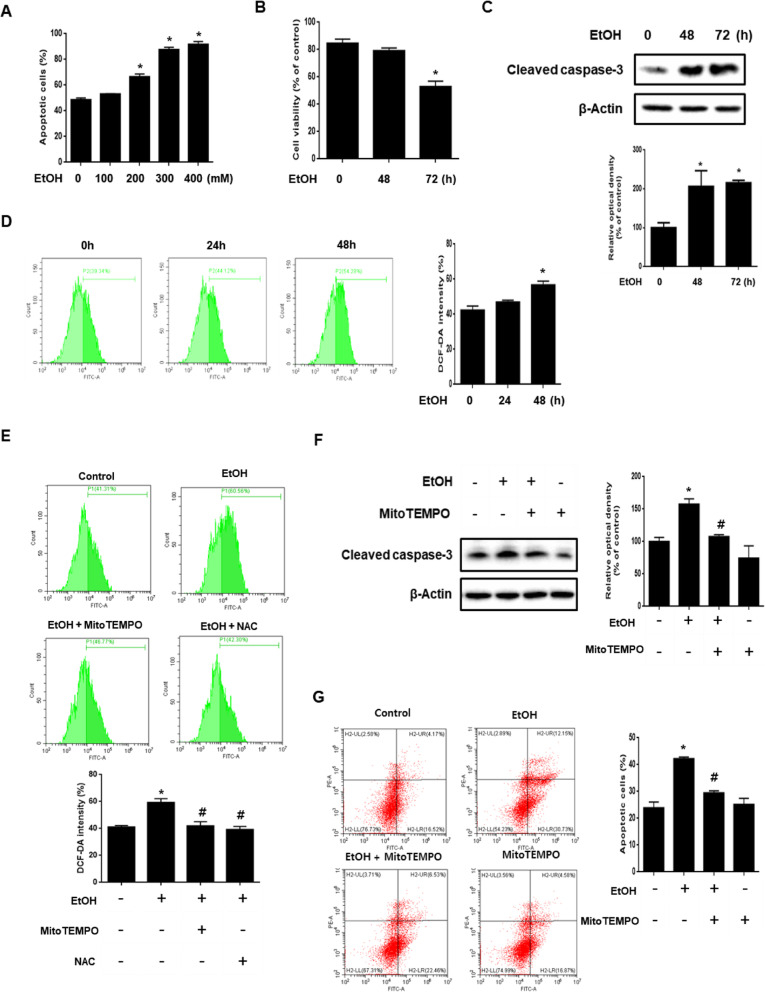
Fig. 1.
Role of ethanol-induced mitochondrial ROS accumulation in neuronal cell death. a SK-N-MC cells were incubated with various concentration of EtOH (100–400 mM) for 72 h. Quantitative analysis of the fold changes of late apoptotic cells were measured by using annexin V/PI staining with flow cytometry. Data are presented as a mean ± S.E.M. n = 4. b Cells were exposed to EtOH (200 mM) for 0–72 h. Cell viability was measured by trypan blue exclusion assay. Data are presented as a mean ± S.E.M. n = 4. c Cells were exposed to EtOH (200 mM) for 0–72 h. Cleaved caspase-3 was detected by western blot. Data are presented as a mean ± S.E.M. n = 3. d Cells were treated with EtOH (200 mM) in a time-dependent manner, ROS measurement by H2DCF-DA was conducted by flow cytometry. Data are presented as a mean ± S.E.M. n = 3. e Cells were pretreated with mitoTEMPO (2 μM) and NAC (5 mM) for 30 min and incubated with ETOH (200 mM) for 48 h. Then H2DCF-DA was incubated for 30 min to detect ROS and it was measured by using flow cytometry. Data are presented as a mean ± S.E.M. n = 3. f Cells were pretreated with mitoTEMPO (2 μM) for 30 min, and then exposed to EtOH (200 mM) for 48 h. Western blotting was conducted to determine the levels of cleaved caspase-3. Data are presented as a mean ± S.E.M. n = 4. g Cells were pretreated with mitoTEMPO (2 μM) for 30 min prior to EtOH treatment for 72 h. Apoptotic cells were detected by annexin V/ PI staining. Data are presented as a mean ± S.E.M. n = 3. All blot images are representative. *p < 0.05 versus control, #p < 0.05 versus EtOH

