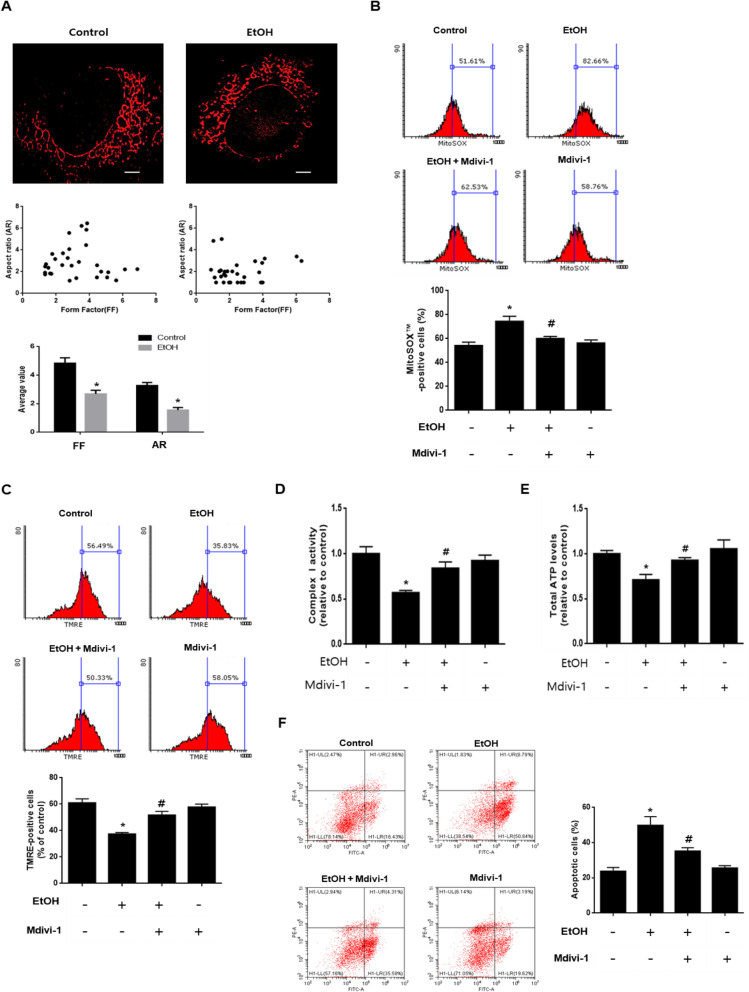
Fig. 4.
Ethanol-induced excessive mitochondrial fission leads to mitochondrial dysfunction. a SK-N-MC cells were exposed to EtOH for 48 h and then loaded with Mitotracker™ Red (200 nM). Representative images were visualized with SRRF imaging system. Scattered plots and average values for form factor (FF) and aspect ratio (AR) were shown on below. Data are presented as a mean ± S.E.M. n = 10. Scale bars are 8 μm (magnification, × 1,000). b Cells were pretreated with Mdivi-1 (1 μM) for 30 min before EtOH treatment for 48 h. Cells were stained with MitoSOX™. The population of MitoSOX™-positive cells was measured by flow cytometry. Data are presented as a mean ± S.E.M. n = 3. c Cells were stained with tetramethylrhodamine ethyl ester (TMRE). The population of TMRE-positive cells was measured by flow cytometry. Data are presented as a mean ± S.E.M. n = 3. d, e Cells were pretreated with Mdivi-1 (1 μM) for 30 min prior to EtOH treatment for 48 h. Mitochondrial complex I activity and intracellular ATP levels were measured respectively and then normalized to cellular protein. Data are presented as a mean ± S.E.M. n = 3. f Cells were pretreated with Mdivi-1 (1 μM) for 30 min before EtOH treatment for 72 h. Apoptotic cells were measured by annexin V/PI analysis assay. Data are presented as a mean ± S.E.M. n = 3. All blot and immunofluorescence images shown are representative. *p < 0.05 versus control, #p < 0.05 versus EtOH

