Fig. 5.
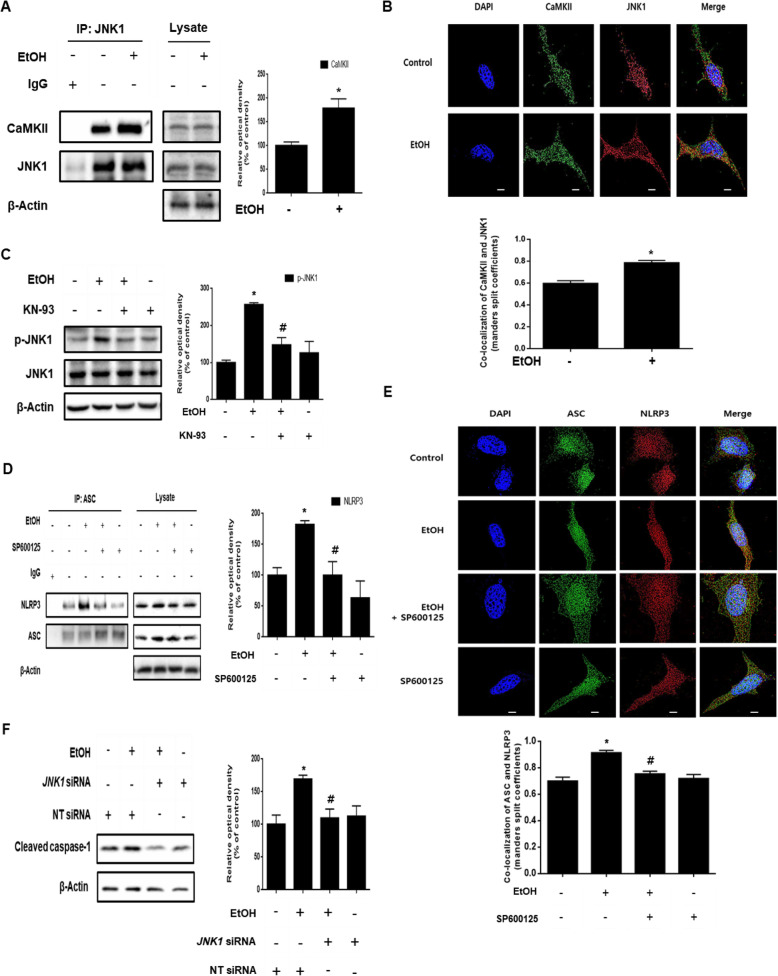
Role of CaMKII/JNK1 pathway in ethanol-induced inflammasome activation. a SK-N-MC cells were incubated EtOH (200 mM) for 24 h and then harvested. JNK1 was immunoprecipitated with anti-JNK1 and anti-CaMKII antibodies (left). The expression of JNK1, CaMKII, and β-Actin in total cell lysates is shown (right). Data are presented as a mean ± S.E.M. n = 3. b Cells were incubated with EtOH for 24 h and immunostained with CaMKII and JNK1 antibodies. Co-localization of CaMKII (green) and JNK1 (red) was visualized with SRRF imaging system. Scale bars are 8 μm (magnification, × 1,000). n = 5. c Cells were pre-treated with KN-93 (1 μM) for 30 min prior to EtOH treatment for 24 h. JNK1 and phosphorylated JNK1 (Thr 183/ Tyr 185) were analyzed by western blotting. β-Actin was used as a loading control. Data are presented as a mean ± S.E.M. n = 4. d Cells were pre-treated with SP600125 (10 μM) for 30 min prior to EtOH treatment for 48 h. ASC was immunoprecipitated with anti-ASC and anti-NLRP3 antibodies (left). The expression of ASC, NLRP3 and β-Actin in total cell lysates is shown (right). Data are presented as a mean ± S.E.M. n = 3. e Cells were immunostained with ASC and NLRP3 antibodies. Co-localization of ASC (green) and NLRP3 (red) was visualized with SRRF imaging system. Scale bars are 8 μm (magnification, × 1,000). n = 4. f Cells were transfected with JNK1 siRNA or NT siRNA for 24 h prior to ethanol exposure for 48 h. Cleaved caspase-1 expression was measured by western blotting. β-Actin was used as a loading control. Data are presented as a mean ± S.E.M. n = 3. All blot and immunofluorescence images shown are representative. *p < 0.05 versus control, #p < 0.05 versus EtOH.

