Fig. 6.
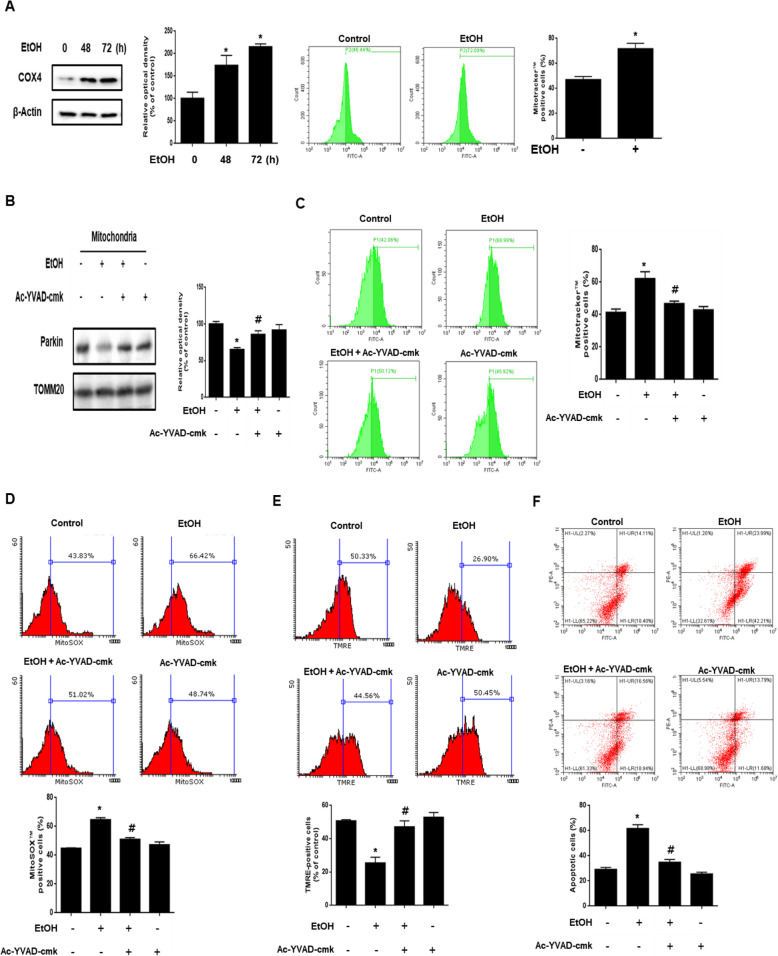
Role of ethanol-induced caspase-1 activation in parkin-mediated mitophagy inhibition. a Cells were exposed to EtOH (200 mM) for 0–72 h. COX4 was detected by western blot. β-Actin was used as a loading control. The population of Mitotracker™-positive cells was measured by flow cytometry. Data are presented as a mean ± S.E.M. n = 3. b parkin and TOMM20 with mitochondrial fractionized samples were detected by western blot. Data are presented as a mean ± S.E.M. n = 4. c Cells were pre-treated with Ac-YVAD-cmk (10 μM) for 30 min prior to EtOH treatment for 48 h. Cells were stained with Mitotracker™. The population of Mitotracker™-positive cells was measured by flow cytometry. Data are presented as a mean ± S.E.M. n = 4. d The population of MitoSOX™-positive cells was measured by flow cytometry. Data are presented as a mean ± S.E.M. n = 3. e The population of TMRE-positive cells was measured by flow cytometry. Data are presented as a mean ± S.E.M. n = 4. f Cells were pretreated with Ac-YVAD-cmk (10 μM) for 30 min before ethanol treatment for 72 h. Apoptotic cells were measured by annexin V/PI analysis assay. Data are presented as a mean ± S.E.M. n = 3. All blot images are representative. *p < 0.05 versus control, #p < 0.05 versus EtOH

