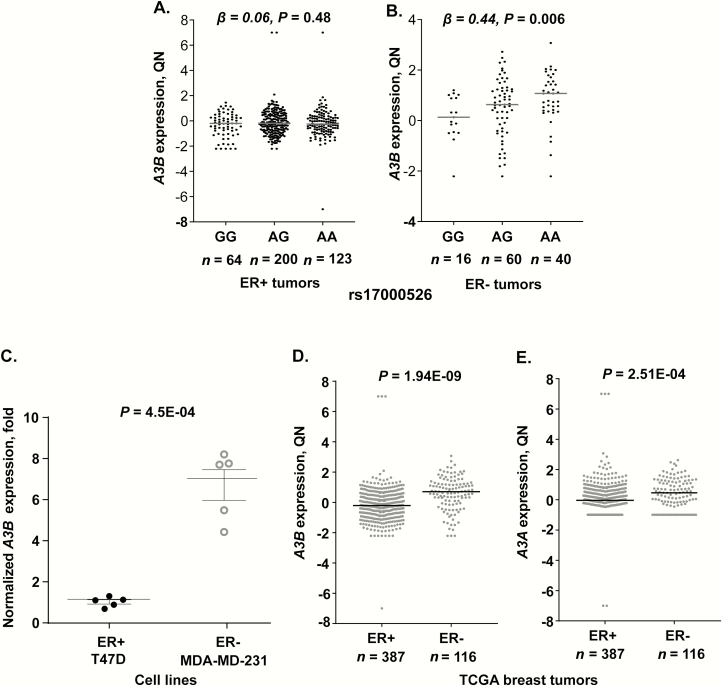
Figure 3.
A3B mRNA expression in 503 breast tumors in TCGA and breast cancer cell lines. (A and B) A3B expression in relation to genotypes of the regulatory germline SNP rs17000526 in 387 ER+ and 116 ER− tumors. Per-allele β (effect size) and P-values are for multivariable linear regression models, controlling for age, race, tumor stage and expression of the A3AB isoform that corresponds to the germline deletion of A3B. (C). Baseline A3B expression normalized to endogenous controls is higher in the ER− cell line, MDA-MB-231, compared with the ER+ cell line, T-47D. P-value is for an unpaired two-sided t-test based on 5 biological replicates. (D and E) Expression of A3B and A3A in 503 breast tumors in TCGA (387 ER+ and 116 ER−); P-values are for one-way analysis of covariance adjusting for age, race and tumor stage. Plots show individual data values, group means and standard deviations. QN-quantile-normalized expression.

