Figure 1.
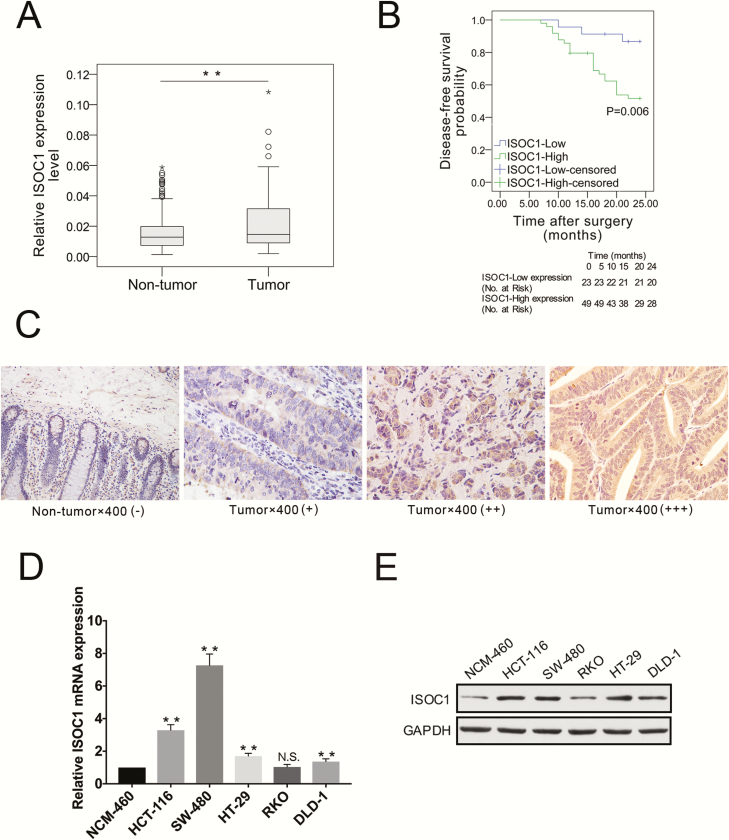
ISOC1 expression in ygjufikyfi samples NNNNNNNNNlk/0124528 cell lines. (A) ISOC1 expression was analyzed by qRT–PCR in 106 paired samples including tumor and adjacent non-tumor tissues. Statistical analysis was performed using the Wilcoxon signed ranks test, and the horizontal line indicates the median value. (B) The patient’s 2-year disease-free survival (DFS) data, which were analyzed by the Kaplan–Meier method, were used to reflect the effect of the ISOC1 expression level on clinical prognosis. The survival probability of the ISOC1-high expression group (n = 49) was significantly lower than that of the ISOC1-low expression group (n = 23; log-rank test; P = 0.006). The cutoff threshold of ISOC1 expression is determined using the Youden index of receiver operating characteristic curves. (C) Representative immunohistochemistry staining of ISOC1 in CRC tissues and adjacent non-tumor tissues (×400). Negative: −~+; Positive: ++~+++. (D, E) ISOC1 mRNA and protein expression levels in colon cancer cell lines.

