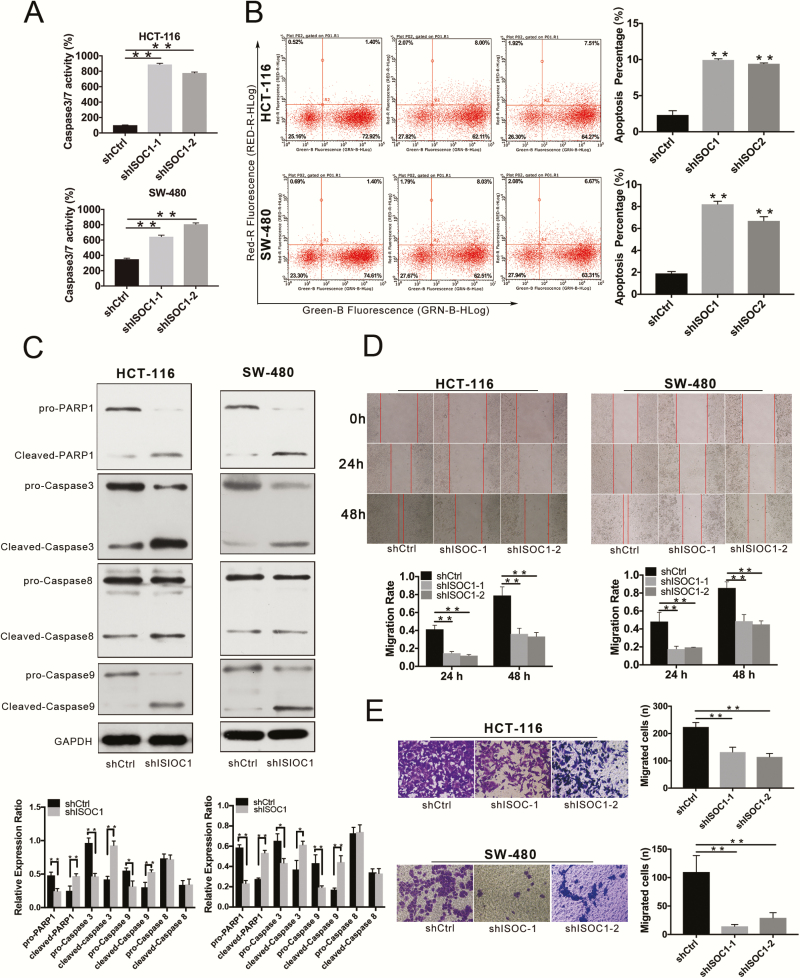
Figure 3.
ISOC1 expression in CRC samples and cell lines. (A) Caspase-3/7 activity assay. Statistical analysis of caspase-3/7 activity in the shCtrl, shISOC1-1 and shISOC1-2 groups. (B) Cell apoptosis assay. Representative flow cytometric images in the shCtrl, shISOC1-1 and shISOC1-2 groups. (C) Western blot assay. The protein expression levels of cleaved PARP-1 and cleaved caspase-3 and -9 were increased in the shISOC1 (shISOC1-1) group compared with the shCtrl group, whereas the expression levels of pro-PARP-1 and pro-caspase-3 and -9 were decreased in the shISOC1 group compared with the shCtrl group. (D) Wound healing assay. The migration rate is derived from the ratio of the difference in wound width at different times to the initial wound width. (E) Transwell migration assays. The error bars represent the standard deviation. *P < 0.05, **P < 0.01.

