
Figure 1.
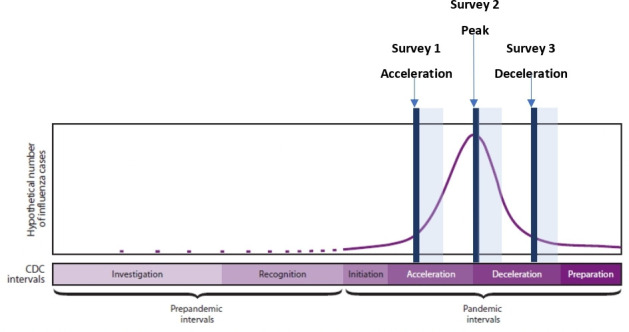
Timing of surveys in accordance with pandemic preparedness model. Solid blue line represents date of survey issue, transparent blue area represents data collection period (as adapted from the Centre for Disease Control (CDC)21).
Official websites use .gov
A
.gov website belongs to an official
government organization in the United States.
Secure .gov websites use HTTPS
A lock (
) or https:// means you've safely
connected to the .gov website. Share sensitive
information only on official, secure websites.
Timing of surveys in accordance with pandemic preparedness model. Solid blue line represents date of survey issue, transparent blue area represents data collection period (as adapted from the Centre for Disease Control (CDC)21).