Figure 2.
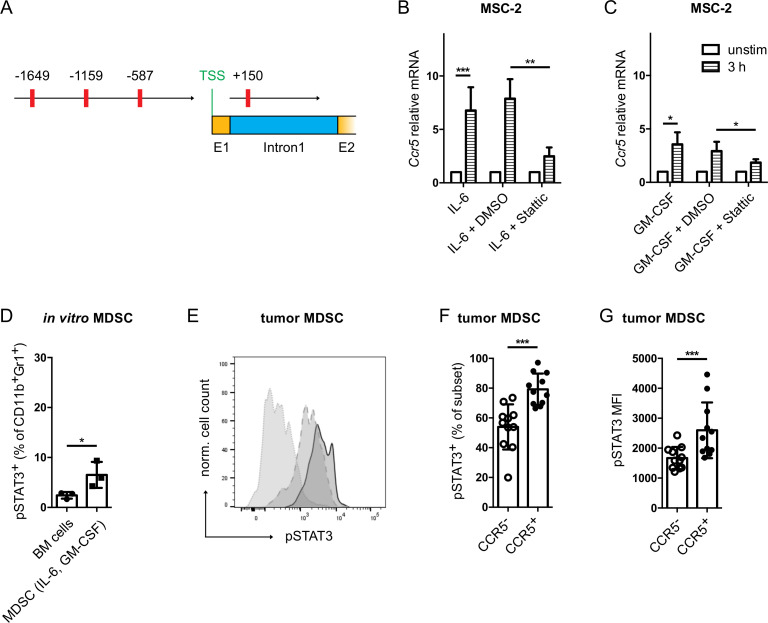
IL-6 and GM-CSF induced CCR5 upregulation is STAT3 dependent. (A) The murine Ccr5 gene sequence was extracted from the NCBI database (Gene-ID: 12774). The TFbind online tool was used to search for STAT3 binding sites in the two Ccr5 promoters. The predicted STAT3 binding sites are shown in red with their respective distance to the transcription start site. MSC-2 cells were stimulated with IL-6 (B) or GM-CSF (C) together with the STAT3 inhibitor Stattic (10 µM) for 3 hours. Ccr5 mRNA expression was measured by qRT-PCR (mean±SEM; n=3). (D) Bone marrow cells were differentiated into MDSC with IL-6 and GM-CSF. pSTAT3 expression was measured by flow cytometry. Data are shown as the percentage of pSTAT3+ cells within total MDSC (mean±SD; n=3). (E) Evaluation of pSTAT3 expression in tumor infiltrating MDSC. A representative histogram for pSTAT3 staining is shown (dotted line: isotype control, dashed line: CCR5− MDSC, solid line: CCR5+ MDSC). (F) The frequency of tumor-infiltrating pSTAT3+ MDSC is expressed as the percentage within CCR5+ or CCR5− MDSC (mean±SD; n=10). (G) The level of pSTAT3 expression in CCR5+ or CCR5− MDSC is presented as median fluorescence intensity (mean±SD; n=10). *p<0.05, **p<0.01, ***p<0.001. BM, bone marrow; CCR5, C–C chemokine receptor; GM-CSF, granulocyte macrophage colony-stimulating factor; IL, interleukin; MDSC, myeloid-derived suppressor cells.

