Figure 4.
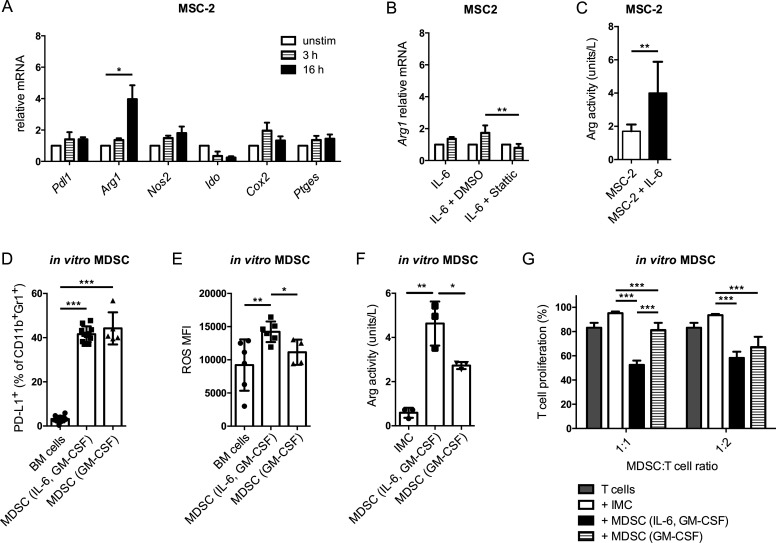
IL-6 increased MDSC-mediated immunosuppression via the stimulation of Arg1. (A) MSC-2 cells were incubated with 40 ng/mL IL-6 for 3 and 16 hours. The mRNA expression of indicated genes was measured by qRT-PCR (mean±SEM; n=3). (B) MSC-2 cells were cocultured with 40 ng/mL IL-6 together with the STAT3 inhibitor Stattic (10 µM) for 3 hour. Arg1 mRNA expression was measured by qRT-PCR (mean±SEM; n=3). (C) MSC-2 cells were incubated with IL-6 for 24 hours. Arg activity was measured using the Arginase Activity Assay Kit and expressed as units/L (mean±SD; n=9). (D–F) MDSC were generated by IL-6 and GM-CSF or GM-CSF only. PD-L1 expression and ROS production were measured by flow cytometry. Arg activity was detected by the Arginase Activity Assay Kit. The data are presented as the percentage of PD-L1+ MDSC among total MDSC (D), as the MFI of ROS producing cells (E) and as units/L of Arg activity (mean±SD; n=3–10). (G) Suppressive capacity of MDSC differentiated with IL-6 and GM-CSF or GM-CSF only was determined in the suppression of T cell proliferation assay with activated CD8+ T cells. Cumulative data for the inhibition of CD8+ T cell proliferation by generated MDSC are presented as the percentage of divided T cells (mean±SD; n=6). MDSC:T cell ratios were as indicated. *p<0.05, **p<0.01, ***p<0.001. BM, bone marrow; CCR5, C–C chemokine receptor; CFSE, carboxyfluorescein succinimidyl ester; GM-CSF, granulocyte macrophage colony-stimulating factor; IL, interleukin; IMC, immature myeloid cells; MDSC, myeloid-derived suppressor cells; MFI, median fluorescence intensity; MSC, myeloid suppressor cell line; ROS, reactive oxygen species.

