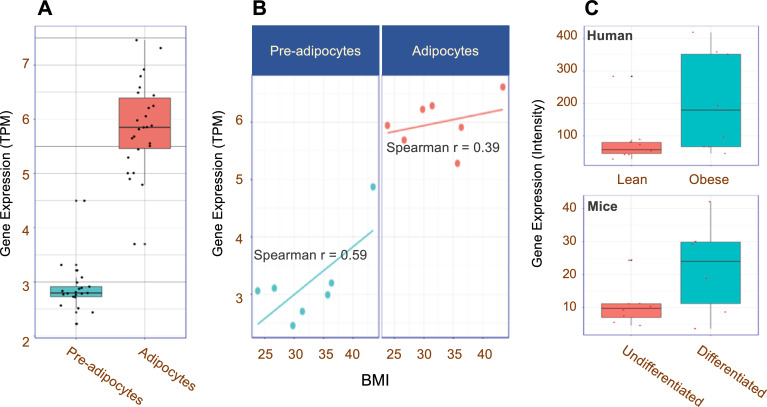
Figure 2.
Expression of CPA3 in fat cells. (A) Boxplot showing relative expression of CPA3 in preadipocytes (n=21) and adipocytes (n=26). (B) Relationships between relative expression of CPA3 and BMI in preadipocytes and adipocytes from same subjects (n=7). (C) Relative CPA3 expression differences in human (lean and obese, n=19) and mice (undifferentiated and differentiating, n=14) models. The original data were downloaded from GEO (GDS3601, GDS2743). BMI, body mass index; GEO, Gene Expression Omnibus.

