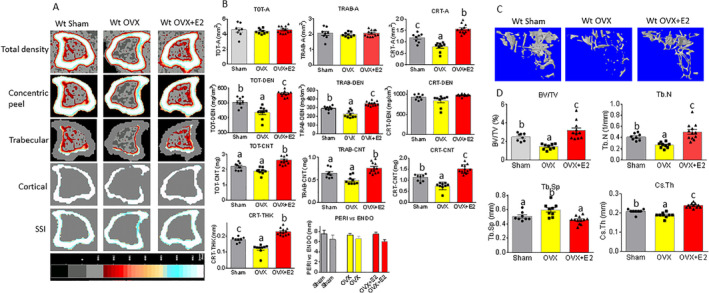
Figure 1.

E2 reverses OVX‐induced bone loss in WT female mice. (A) Sagittal quantitative pQCT scan of one slice of the proximal tibia from one sample of each group of mice. Bar in the bottom shows color changes from black to white indicating bone density from low to high. (B) pQCT measured parameters from three mouse groups. WT sham = WT sham‐operated; WT OVX = WT ovariectomized; WT OVX + E2 = WT ovariectomized plus E2 treatment; TOT‐A, TRAB‐A, CRT‐A = total bone area, trabecular bone area, cortical bone area, mm2; TOT‐DEN, TRAB‐DEN, CRT‐DEN = total BMD, trabecular BMD, cortical BMD, gm/cm3; TOT‐CNT, TRAB‐CNT, CRT‐CNT = total BMC, trabecular BMC, cortical BMC, mg; CRT‐THK = cortical thickness, mm; PERI versus ENDO = periosteal and endosteal circumference, mm. (C) Representative μCT images of the proximal tibia from one sample of each group of mice. (D) μCT measured parameters from three mouse groups. BV/TV = bone volume / total tissue volume; Tb.N = trabecular number; Tb.Sp = trabecular separation; Cs.Th = cortical thickness. Data are expressed as mean ± SD (sham group n = 9; OVX group n = 10; OVX + E2 n = 11). Means with different letters differ significantly from each other, p < 0.05 a < b < c as determined by one‐way ANOVA followed by Student–Newman–Kules post hoc analysis for multiple pairwise comparisons.
