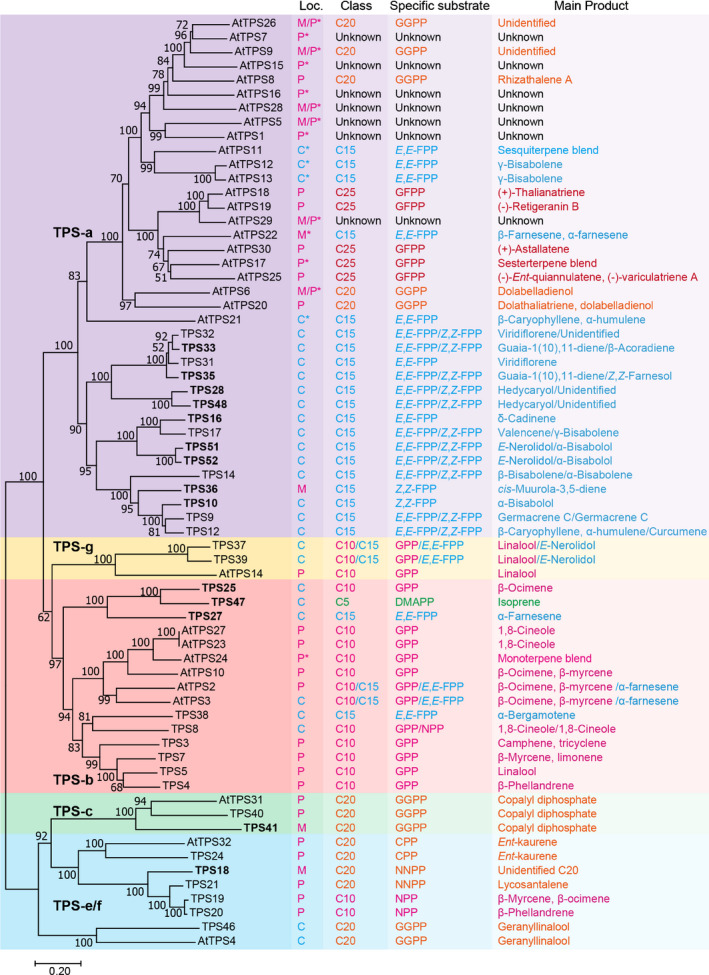
Figure 2.

Phylogenetic analysis of tomato and Arabidopsis TPS gene family. A maximum‐likelihood phylogenetic tree of the TPS proteins is shown on the left panel, while subcellular localisation (Loc.), substrate class, specific substrate and main product of the corresponding enzymes are shown on the right four panels. The TPS‐a, TPS‐g, TPS‐b, TPS‐c and TPS‐e/f clades are shading in purple, yellow, pink, green and blue, respectively. Cytosolic (C) localisation is shown in blue, plastidic (P) and mitochondrial (M) localisations are shown in magenta. Localisations predicted by TargetP and ChloroP are denoted by asterisks. C5, C10, C15, C20 and C25 compounds are shown in green, magenta, blue, orange and red, respectively. Terpene synthases characterised in this work are shown in bold. At, Arabidopsis thaliana; CPP, ent‐copalyl diphosphate; DMAPP, dimethylallyl diphosphate; FPP, farnesyl diphosphate; GFPP, geranylfarnesyl diphosphate; GGPP, geranylgeranyl diphosphate; GPP, geranyl diphosphate; NNPP, nerylneryl diphosphate; NPP, neryl diphosphate; TPS, terpene synthase.
